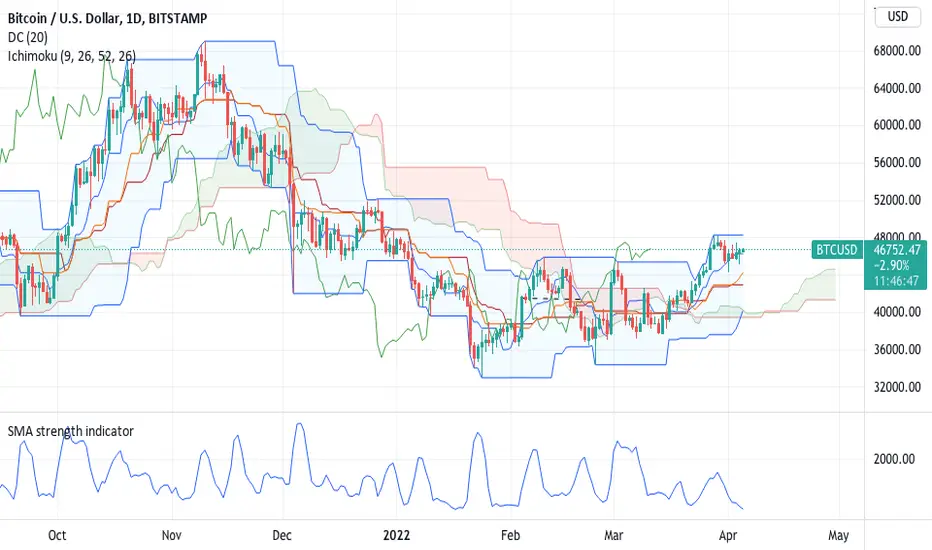
I created a SMA strength indicator, and just trying to find out its usefulness.
It appears each time its in the higher historical range, prices will eventually increase, and when on the higher side, it will move lower.
Based on my personal view on BTC and the indicator, it feels we may see lower levels in the near term again. this suggest a SELL @ $ 46,500-47.750 for a move back below $ 40,000 short-term.
Disclaimer
The information and publications are not meant to be, and do not constitute, financial, investment, trading, or other types of advice or recommendations supplied or endorsed by TradingView. Read more in the Terms of Use.
Disclaimer
The information and publications are not meant to be, and do not constitute, financial, investment, trading, or other types of advice or recommendations supplied or endorsed by TradingView. Read more in the Terms of Use.