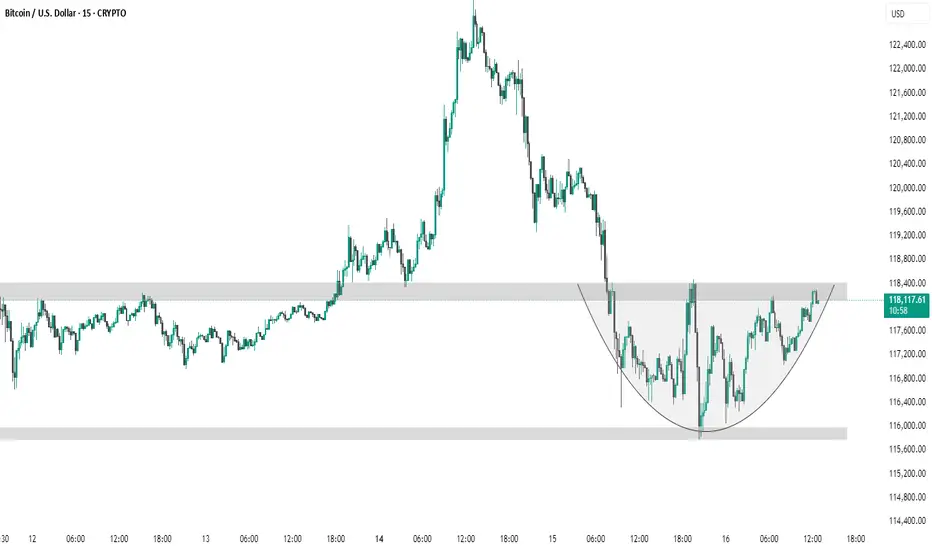
The chart **15-minute Bitcoin (BTC/USD)** candlestick pattern with a clearly drawn **cup and handle** or **rounded bottom** formation. Let's identify key levels:
---
🔍 **Key Levels Identified:**
1. **Resistance Zone (Neckline of Cup)**
Level:** \~**118,400 USD**
Significance:** This is the upper gray zone where price has repeatedly been rejected. It's acting as a **resistance** and also forms the **neckline of the cup pattern**. A breakout above this level may indicate bullish continuation.
2. **Support Zone (Bottom of Cup)**
Level:** \~**115,800 – 116,000 USD**
Significance:** This is the **lowest point** in the recent pullback and serves as strong support**. The price rebounded from here to form the cup.
3. **Mid-Level / Breakout Point**
Current Price:** \~**118,067 USD**
Significance:** Price is testing the **resistance**. A candle close and confirmation above 118,400 could trigger a bullish move, possibly targeting previous highs near **121,600 USD** or more.
---
⚠️ Watch For:
Breakout confirmation above 118,400 USD** with volume for bullish continuation.
Rejection at 118,400 USD** could lead to a pullback or handle formation.
Support holding above 116,000 USD** is key to maintain bullish structure.
Let me know if you want price targets or entry/exit suggestions based on this setup.
thank u
---
🔍 **Key Levels Identified:**
1. **Resistance Zone (Neckline of Cup)**
Level:** \~**118,400 USD**
Significance:** This is the upper gray zone where price has repeatedly been rejected. It's acting as a **resistance** and also forms the **neckline of the cup pattern**. A breakout above this level may indicate bullish continuation.
2. **Support Zone (Bottom of Cup)**
Level:** \~**115,800 – 116,000 USD**
Significance:** This is the **lowest point** in the recent pullback and serves as strong support**. The price rebounded from here to form the cup.
3. **Mid-Level / Breakout Point**
Current Price:** \~**118,067 USD**
Significance:** Price is testing the **resistance**. A candle close and confirmation above 118,400 could trigger a bullish move, possibly targeting previous highs near **121,600 USD** or more.
---
⚠️ Watch For:
Breakout confirmation above 118,400 USD** with volume for bullish continuation.
Rejection at 118,400 USD** could lead to a pullback or handle formation.
Support holding above 116,000 USD** is key to maintain bullish structure.
Let me know if you want price targets or entry/exit suggestions based on this setup.
thank u
Trade active
BTC # ARC Breakout has doneDisclaimer
The information and publications are not meant to be, and do not constitute, financial, investment, trading, or other types of advice or recommendations supplied or endorsed by TradingView. Read more in the Terms of Use.
Disclaimer
The information and publications are not meant to be, and do not constitute, financial, investment, trading, or other types of advice or recommendations supplied or endorsed by TradingView. Read more in the Terms of Use.