Dear traders:
What I Know For Sure:
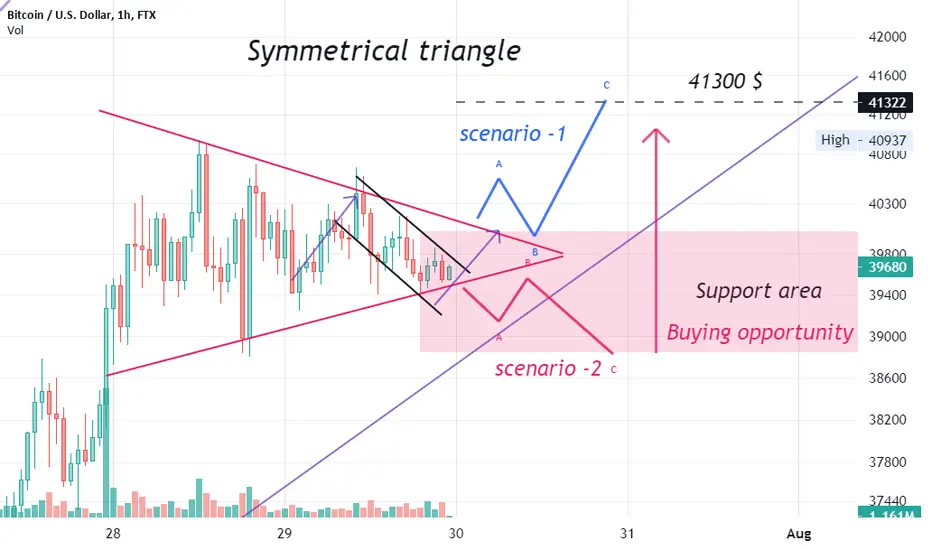
1- The Symmetrical Triangle generally occurs during ranging periods.
2- Edwards and Magee (1948), suggest that roughly 75% of symmetrical triangles are continuation patterns.
3- Breakout needs volume confirmation.
4- What is the most bullish chart pattern? The bull flag.
Possible scenarios are shown in the chart.
Personally: (roughly 99.99% of symmetrical triangles are continuation patterns) bullish :)
Note
Note
Note
Note
Note
41600 $ touched,Note
Related publications
Disclaimer
The information and publications are not meant to be, and do not constitute, financial, investment, trading, or other types of advice or recommendations supplied or endorsed by TradingView. Read more in the Terms of Use.
Related publications
Disclaimer
The information and publications are not meant to be, and do not constitute, financial, investment, trading, or other types of advice or recommendations supplied or endorsed by TradingView. Read more in the Terms of Use.