https://tradingview.sweetlogin.com/x/c1C59CsR/
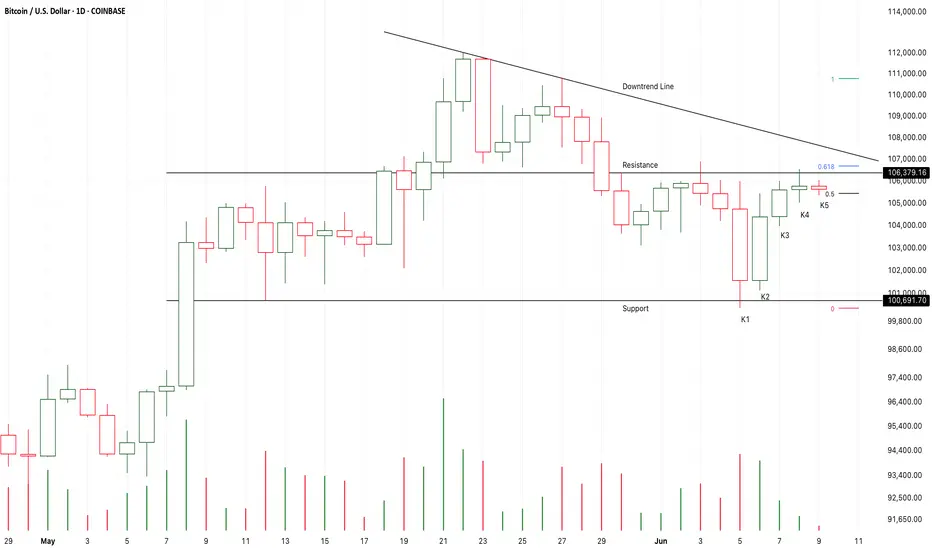
K1 and K2 verified a potential strong support,
If the following candles K5 or K6 close upon the downtrend line like K2,
Another bull run will keep climbing up.
It will be a good place to buy it around the downtrend line.
If the following candles consolidate around the resistance to verify the bullish momentum,
It will also a good place to buy it around the resistance.
On the other hand,
If K5 or K6 close below K4 to verify the resistance,
The market will fall to test the support for more times,
I will try to buy it at about 100K area.
Long-101618/Stop-100618/Target-120K
Long-103188/Stop-102188/Target-120K
Note
K1 nearly close upon the resistance,
It verified the bullish momentum.
It seems that the following candles will finally break up it.
I will try to find opportunities to buy in.
On the other hand,
If K2 or the following candles verified the effectiveness of the resistance,
It is still possible that the market will fall to test 100K area again.
Long-106888/Stop-105888/Target-120K
Long-108988/Stop-107988/Target-112K
Note
K1 and K2 is a bearish harami pattern,
It seems that a short-term consolidation will start here if K3 is still a weak candle to verify the expectation.
If the following candles successfully retest the neck line,
I will try to find opportunities to buy in.
Long-107318/Stop-106318/Target-120K
Trade closed: stop reached
Disclaimer
The information and publications are not meant to be, and do not constitute, financial, investment, trading, or other types of advice or recommendations supplied or endorsed by TradingView. Read more in the Terms of Use.
Disclaimer
The information and publications are not meant to be, and do not constitute, financial, investment, trading, or other types of advice or recommendations supplied or endorsed by TradingView. Read more in the Terms of Use.