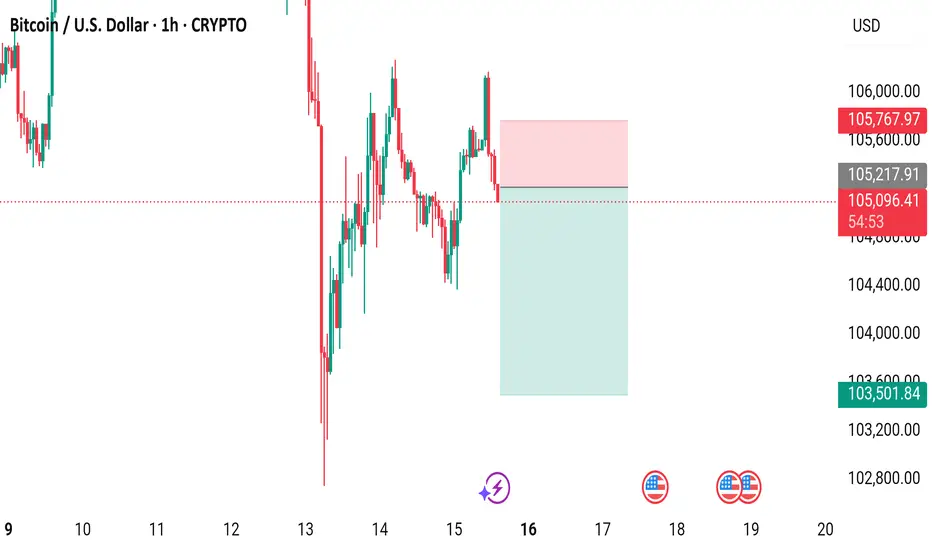
a 1-hour candlestick chart for Bitcoin (BTC) priced in US Dollars (USD), showing a recent price of $105,154.79 with a slight decline of -0.30% (-$311.19). The chart highlights a price range between $103,501.84 and $106,000.00, with a notable support level around $105,154.79 and a resistance zone shaded in pink between $105,217.91 and $105,767.97. The time frame spans from 10:00 to 20:00, with the current time at approximately 15:00.
Daily XAU/USD FREE setups | Let's grow together!
| XAU/USD Trader | Telegram: https://t.me/Aleegoldsignals
| XAU/USD Trader | Telegram: https://t.me/Aleegoldsignals
Disclaimer
The information and publications are not meant to be, and do not constitute, financial, investment, trading, or other types of advice or recommendations supplied or endorsed by TradingView. Read more in the Terms of Use.