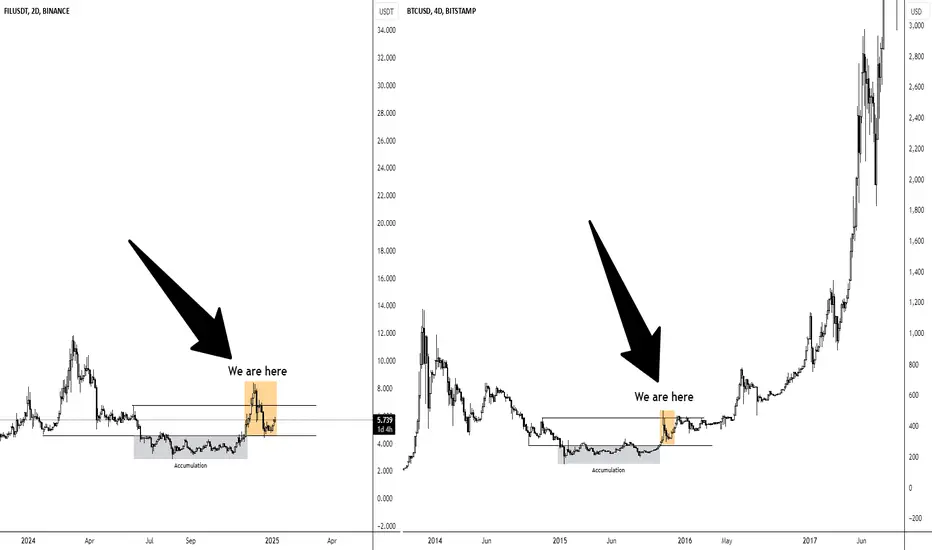
This chart compares the price structure of FIL (left) with BTC (right) from 2015/2016 to highlight similarities in price behavior.
The key observation is the accumulation phase where the price trades within a defined zone for an extended period, eventually breaking out with significant volume, indicating strength and demand.
After breaking out, the price typically retraces into an orange zone, a phase where many participants get burned due to their unrealized gains being lost quickly, often causing panic and liquidation. This retracement is frequently mistaken for a "suckers rally."
However, this orange zone marks the re-accumulation phase, where smart money enters again before the real price expansion begins. The current chart shows similar price behavior to what we saw in BTC in 2015/2016. Despite differences in liquidity and volume back then, the same pattern is visible.
As for a potential selling point, we are looking at May 2025, although it's difficult to predict the exact peak of altcoins during this phase. The FIL chart essentially represents the broader altcoin market, as most altcoins exhibit similar structures and price movements.
💎💎- Professional Trader
💎💎 - Discord: discord.gg/gHKNVMyEvd
💎💎 - Trading Course: liquiditysweep369.carrd.co/
💎💎 - Discord: discord.gg/gHKNVMyEvd
💎💎 - Trading Course: liquiditysweep369.carrd.co/
Disclaimer
The information and publications are not meant to be, and do not constitute, financial, investment, trading, or other types of advice or recommendations supplied or endorsed by TradingView. Read more in the Terms of Use.