Hello, traders!Who interesting in Bitcoin next price movement, let's look at daily chart!

We can see that this time we also forming an ascending triangle.
These patterns of technical analysis are distinguished by some “deceit”, be careful working with them❗
That's because during their formation it's rather difficult to unambiguously determine in which direction the price impulse will follow - up or down.🤷🏻♀️
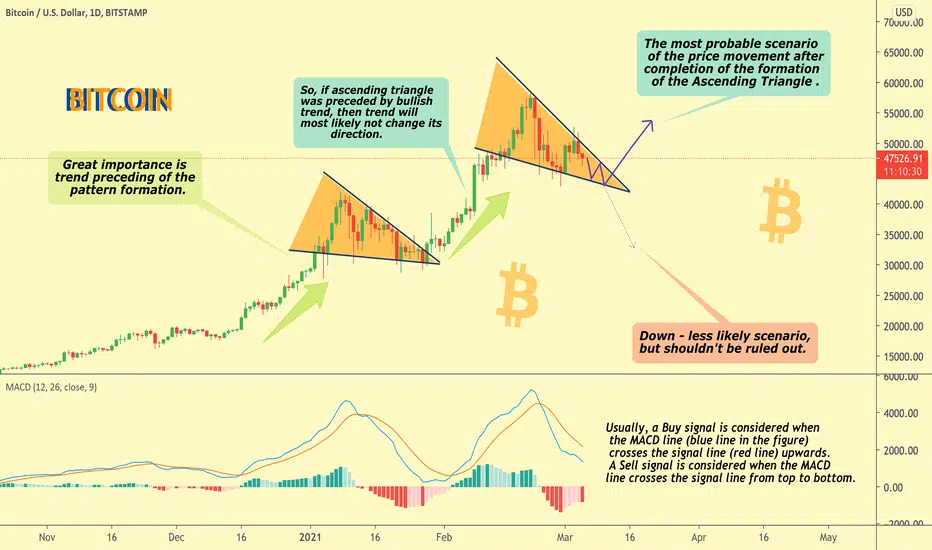
Great importance ❗is what trend preceding the pattern formation.
So,🔥 if the ascending triangle was preceded by a bullish trend, then the trend will most likely not change its direction.
The most probable scenario of the price movement after completion of the formation of the Ascending Triangle - is going UP.
Going DOWN- less likely scenario, but shouldn't be ruled out.
Thus, in most cases, the “Rising Triangle” is seen by traders as a bullish pattern.
The appearance of this figure usually indicates consolidation (which good for alts growth ) before the resumption of the upward movement.❗
MACD. Usually, a Buy signal is considered when the MACD line (blue line in the figure) crosses the signal line (red line) upwards. A Sell signal is considered when the MACD line crosses the signal line from top to bottom.
I hope, my chart was helpful for You ♥️
Thank You for supporting! Appreciate each of You😊
💋
Stay tuned by Rocket Bomb 🚀💣
We can see that this time we also forming an ascending triangle.
These patterns of technical analysis are distinguished by some “deceit”, be careful working with them❗
That's because during their formation it's rather difficult to unambiguously determine in which direction the price impulse will follow - up or down.🤷🏻♀️
Great importance ❗is what trend preceding the pattern formation.
So,🔥 if the ascending triangle was preceded by a bullish trend, then the trend will most likely not change its direction.
The most probable scenario of the price movement after completion of the formation of the Ascending Triangle - is going UP.
Going DOWN- less likely scenario, but shouldn't be ruled out.
Thus, in most cases, the “Rising Triangle” is seen by traders as a bullish pattern.
The appearance of this figure usually indicates consolidation (which good for alts growth ) before the resumption of the upward movement.❗
MACD. Usually, a Buy signal is considered when the MACD line (blue line in the figure) crosses the signal line (red line) upwards. A Sell signal is considered when the MACD line crosses the signal line from top to bottom.
I hope, my chart was helpful for You ♥️
Thank You for supporting! Appreciate each of You😊
💋
Stay tuned by Rocket Bomb 🚀💣
Note

Disclaimer
The information and publications are not meant to be, and do not constitute, financial, investment, trading, or other types of advice or recommendations supplied or endorsed by TradingView. Read more in the Terms of Use.
Disclaimer
The information and publications are not meant to be, and do not constitute, financial, investment, trading, or other types of advice or recommendations supplied or endorsed by TradingView. Read more in the Terms of Use.