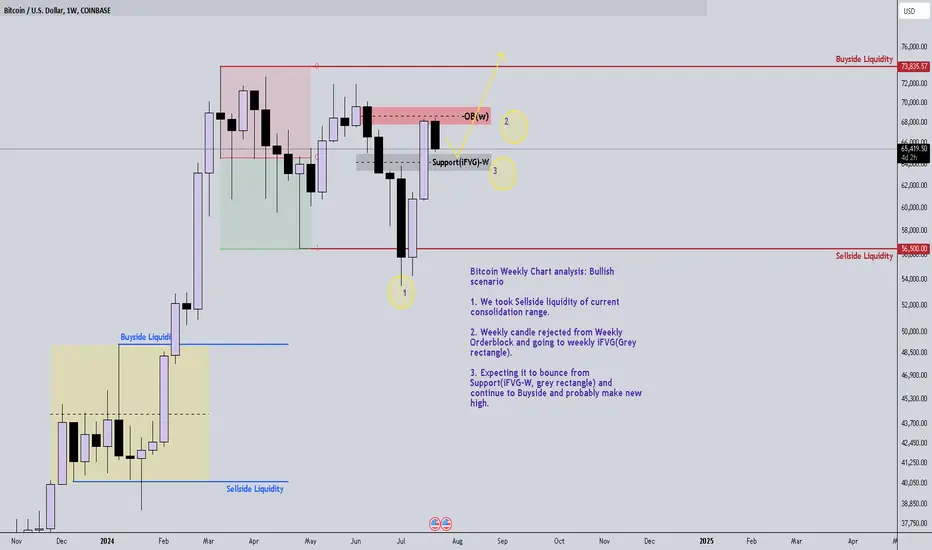
Bitcoin Weekly Chart analysis: Bullish scenario
1. We took Sellside liquidity of current consolidation range.
2. Weekly candle rejected from Weekly Orderblock and going to weekly iFVG(Grey rectangle).
3. Expecting it to bounce from Support(iFVG-W, grey rectangle) and continue to Buyside and probably make new high.
1. We took Sellside liquidity of current consolidation range.
2. Weekly candle rejected from Weekly Orderblock and going to weekly iFVG(Grey rectangle).
3. Expecting it to bounce from Support(iFVG-W, grey rectangle) and continue to Buyside and probably make new high.
Related publications
Disclaimer
The information and publications are not meant to be, and do not constitute, financial, investment, trading, or other types of advice or recommendations supplied or endorsed by TradingView. Read more in the Terms of Use.
Related publications
Disclaimer
The information and publications are not meant to be, and do not constitute, financial, investment, trading, or other types of advice or recommendations supplied or endorsed by TradingView. Read more in the Terms of Use.