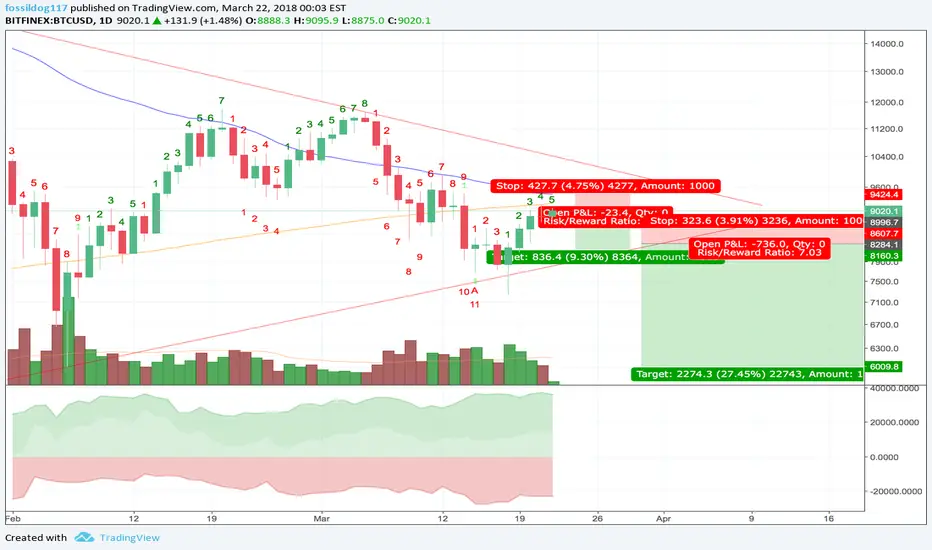
- Leveraged longs at all time high as suggested by the BFX long vs short indicator.
- Price is below 50 and 200 MA, possible death cross.
- Volume continuously decreasing
- Time indicator would suggest either:
(a) the 1-4 day correction is over and we fall now, or
(b) we see a continued rally to a green 8 or 9 followed by a red 1. (this would be an ideal trap scenario)
A good short opportunity would be sometime between now and the next 2-3 days.
Stop-loss at $9400 (around the 50 MA)
If a breakdown occurs then double down on the short position as this would probably lead to a bear break of the triangle formation. With a new stop loss at $8600
Note
Take profit at $7000-6000 rangeNote
Stop loss at break evenNote
Generally position should be closed at this stageDisclaimer
The information and publications are not meant to be, and do not constitute, financial, investment, trading, or other types of advice or recommendations supplied or endorsed by TradingView. Read more in the Terms of Use.
Disclaimer
The information and publications are not meant to be, and do not constitute, financial, investment, trading, or other types of advice or recommendations supplied or endorsed by TradingView. Read more in the Terms of Use.