Hello! Friends,
I can with new research an idea but, before to start to talk about technical Let's share your LOVE by giving me LIKES and COMMENTS. Thanks in advance.
--------------------------------------------------------------------------------------------------------------------
"" Intraday(30min charts) CHART ""
--------------------------------------------------------------------------------------------------------------------
PART (i):

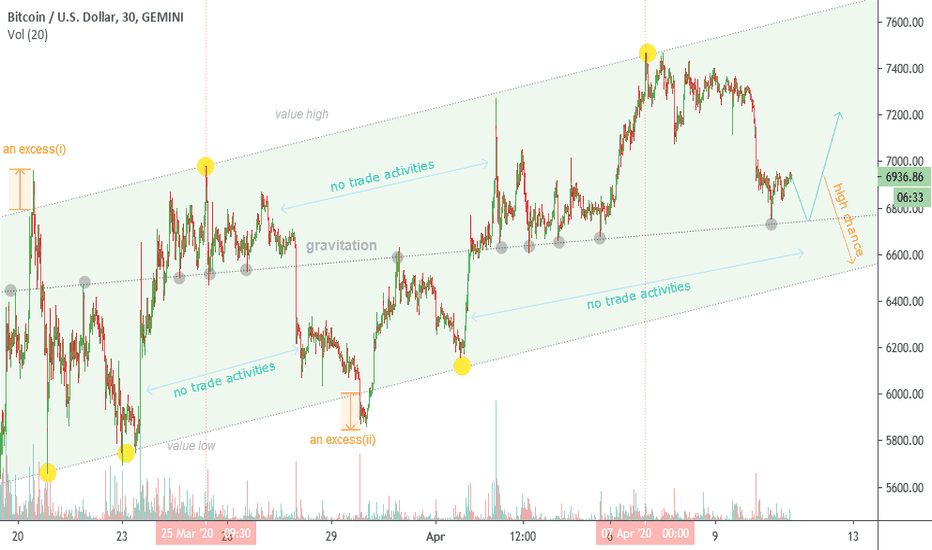
On the parallel channel (value area) are plotted following analysis-:
* At the value high, 4 yellow dotted.
* 5 touching on the Control Price line
* 3 Dots having value low
* An excess found.
--------------------------------------------------------------------------------------------------------------------
"" DAILY CHART ""
--------------------------------------------------------------------------------------------------------------------
PART (i):
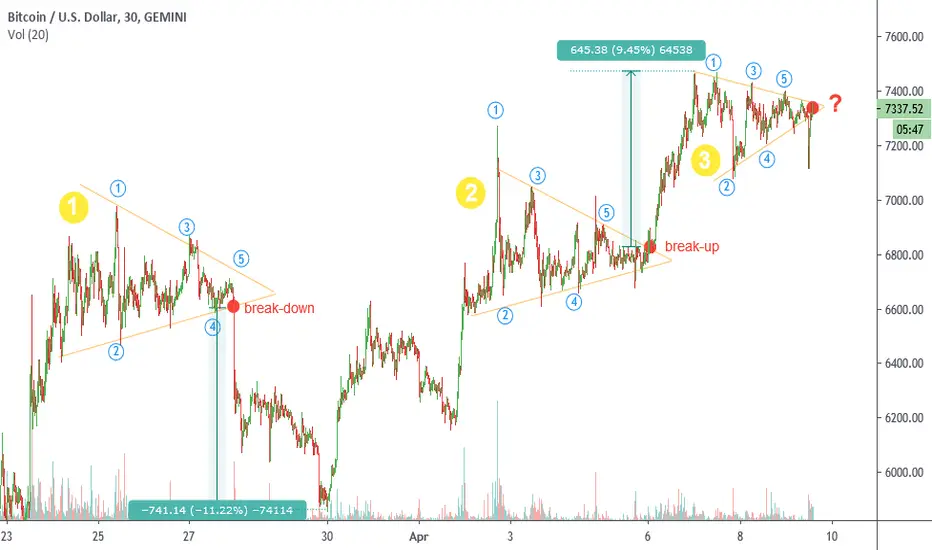
ake a look at your Triangles:-

PART (ii):

Look at the "?" breakout is the question.
Remarkable point:
=> 1) Volume started to rise while last tested at value low(b) which sign of up-breakout. if there's up the breakout, then price not break (b) orange line (gravitation).
=> 2) Point should be noted that many Dots or many times price tried to touch at value low("b" line).
--------------------------------------------------------------------------------------------------------------------
"" WEEKLY CHART ""
--------------------------------------------------------------------------------------------------------------------

Following patterns has been detected-:
Bitcoin is trading in Up-Wave.
!
!
!
!
--------------------------------------------------------------------------------------------
"PAST PERFORMANCE"
--------------------------------------------------------------------------------------------
Successfully followed my steps by bitcoin.
(CLICK ABOVE CHART)
I can with new research an idea but, before to start to talk about technical Let's share your LOVE by giving me LIKES and COMMENTS. Thanks in advance.
- Take a look at your Triangles
--------------------------------------------------------------------------------------------------------------------
"" Intraday(30min charts) CHART ""
--------------------------------------------------------------------------------------------------------------------
PART (i):
On the parallel channel (value area) are plotted following analysis-:
* At the value high, 4 yellow dotted.
* 5 touching on the Control Price line
* 3 Dots having value low
* An excess found.
--------------------------------------------------------------------------------------------------------------------
"" DAILY CHART ""
--------------------------------------------------------------------------------------------------------------------
PART (i):
ake a look at your Triangles:-
PART (ii):
Look at the "?" breakout is the question.
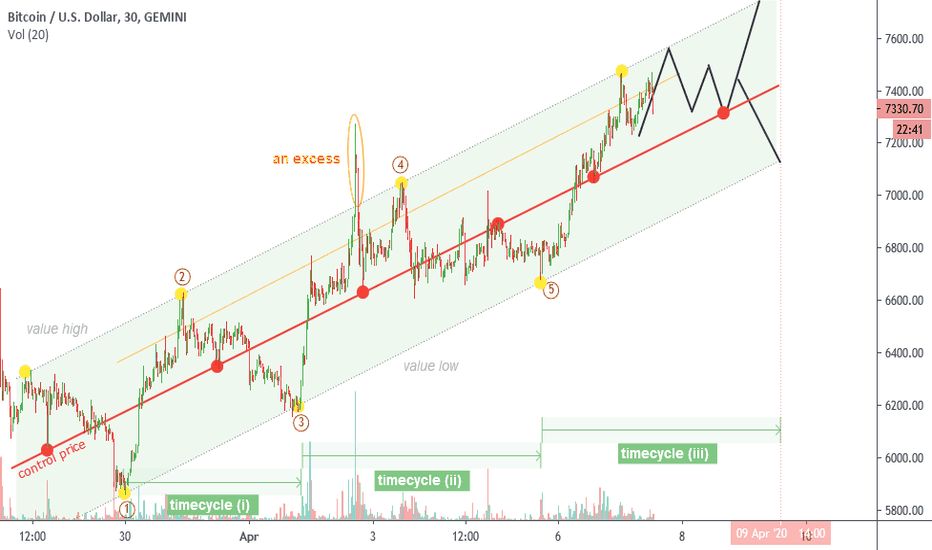
- 2-control lines
- parallel channel with value high and low
- an excess found(penetration)
Remarkable point:
=> 1) Volume started to rise while last tested at value low(b) which sign of up-breakout. if there's up the breakout, then price not break (b) orange line (gravitation).
=> 2) Point should be noted that many Dots or many times price tried to touch at value low("b" line).
--------------------------------------------------------------------------------------------------------------------
"" WEEKLY CHART ""
--------------------------------------------------------------------------------------------------------------------
Following patterns has been detected-:
- initiative movie
- two triangles
- rounded move with low volume
- tails (while u-turn )
Bitcoin is trading in Up-Wave.
!
!
!
!
--------------------------------------------------------------------------------------------
"PAST PERFORMANCE"
--------------------------------------------------------------------------------------------
Successfully followed my steps by bitcoin.
(CLICK ABOVE CHART)
Trade active
Trade active
Channel Support exist :6861.93
Broken
Broken
Trade active
Correction little bit in parallel channel : Trade closed: target reached
Note
NEW IDEA PUBLISHED for you: You can take a trade on it 
Note
Trade is activated on BITCOIN. Kindly check out my RPOFILE or LAST updatd IDEA for Bitcoin. You wil get there trading levels with target.Trade closed: target reached
Dont forget to follow me for New accurate trade setup realtime notification.Disclaimer
The information and publications are not meant to be, and do not constitute, financial, investment, trading, or other types of advice or recommendations supplied or endorsed by TradingView. Read more in the Terms of Use.
Disclaimer
The information and publications are not meant to be, and do not constitute, financial, investment, trading, or other types of advice or recommendations supplied or endorsed by TradingView. Read more in the Terms of Use.