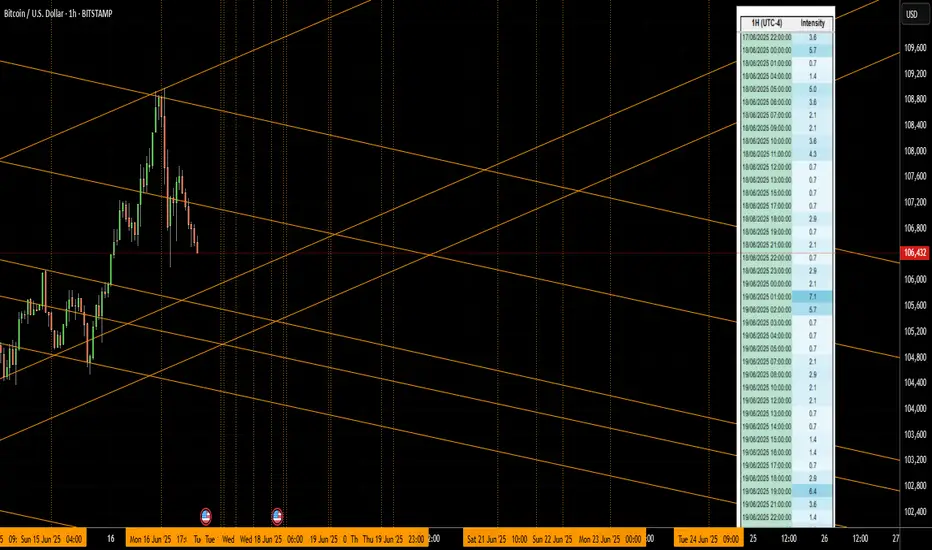
Vertical lines represent cycle clusters.
The price tends to change direction or breakout/accelerate around these timelines.
The right-hand table shows cycle intensity for the next days.
The price tends to change direction or breakout/accelerate around these timelines.
The right-hand table shows cycle intensity for the next days.
Trade active
A large period between cycle clusters may indicate a directional move, as seen in past occurrences.After all, vertical lines are TIME support and resistance lines ;-)
Gonçalo Moreira
Disclaimer
The information and publications are not meant to be, and do not constitute, financial, investment, trading, or other types of advice or recommendations supplied or endorsed by TradingView. Read more in the Terms of Use.
Gonçalo Moreira
Disclaimer
The information and publications are not meant to be, and do not constitute, financial, investment, trading, or other types of advice or recommendations supplied or endorsed by TradingView. Read more in the Terms of Use.