Hello traders here's my New BTC/USD idea, what you think on it? share your thoughts in comment section
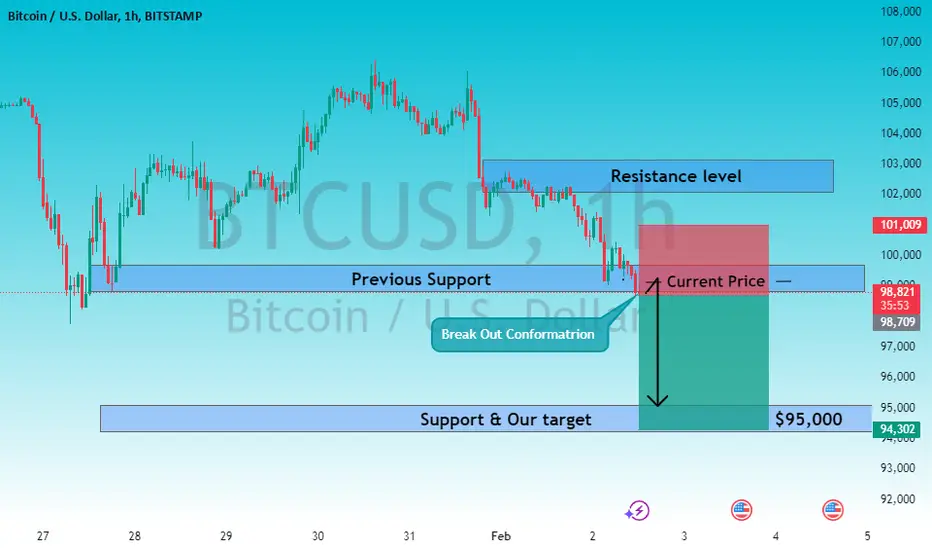
This is a technical analysis chart for Bitcoin (BTC/USD) on the 1-hour timeframe, presenting a bearish trade setup. The chart incorporates key support and resistance levels, trend direction, and breakout confirmation to guide the trade idea.
Trend Analysis
The price is in a downtrend, confirmed by lower highs and lower lows over the past sessions.
The breakdown below the previous support near $99,000 confirms bearish momentum.
The bearish trend aligns with the broader market sentiment, as sellers dominate short-term price movements.
Technical Analysis
1. Resistance Zone:
Around $101,000, this zone as a key rejection area where the price failed to sustain a rally.
Multiple rejections at this level reinforce the strength of resistance.
2. Breakout Confirmation:
Price broke below the previous support at $99,000, turning it into resistance.
A successful retest of this level (now resistance) signals a continuation of the bearish trend.
3. Target Level:
The next support level at $95,000, serving as the downside target for the trade .
This level aligns with historical demand zones where buyers previously entered.
4. Risk Management:
Stop-loss placement above the resistance level near $101,000 ensures risk is limited if the bearish thesis fails.
Fundamental Analysis
Macroeconomic Factors:
A potential tightening in liquidity or hawkish policies from central banks could pressure risk assets, including Bitcoin.
Negative sentiment from regulatory news or low trading volume also contributes to bearish momentum.
Market Correlation:
Bitcoin's decline is consistent with broader market weakness in cryptocurrency, as risk-off sentiment dominates.
Conclusion
a short trade targeting $95,000 with strict risk management. It combines bearish price action, a clear downtrend, and fundamental headwinds to reinforce the potential for further downside. A confirmed breakdown and retest of resistance at $99,000 add confidence to the trade.
Follow me for more updates and don't forget to share my idea with your friends and family
Trade closed: target reached
Hello Guy's As Told That Market Will Fall Till $95,000 As Per My Analysis And Now You Can See Market Reached At $91,000 What A Amazing Waterfall For BTC USD 800+ Pips Profit Achieved Enjoy The Profit And Wait For My New Idea Must Support Me And Share My Analysis With Your Friends and family ThanksDisclaimer
The information and publications are not meant to be, and do not constitute, financial, investment, trading, or other types of advice or recommendations supplied or endorsed by TradingView. Read more in the Terms of Use.
Disclaimer
The information and publications are not meant to be, and do not constitute, financial, investment, trading, or other types of advice or recommendations supplied or endorsed by TradingView. Read more in the Terms of Use.