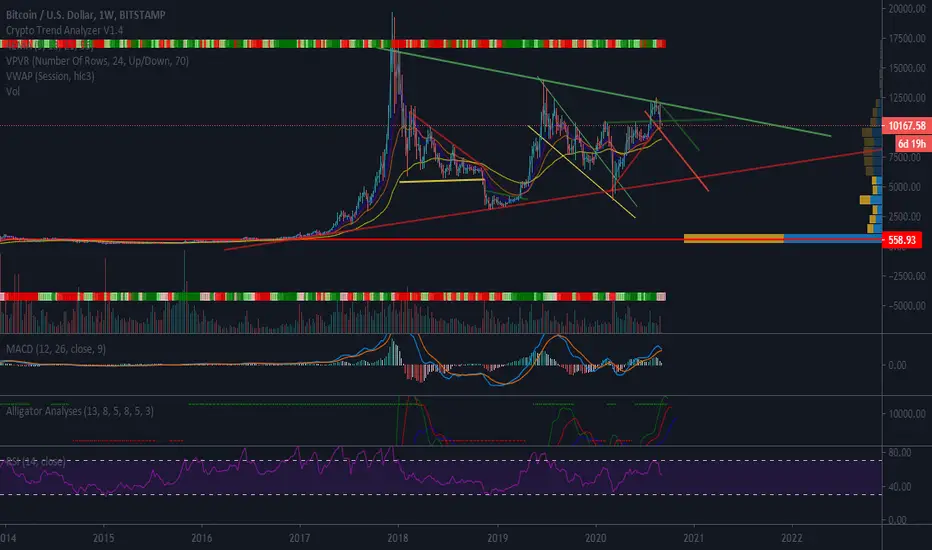
Looking at a long term chart I see that we have support down at $5900- 6000, as pointed out by CryptoCheck, aka Marty Boots. Thus, from his chart I looked at a longer time frame and saw the same within my chart. I have added my recent and speculative channel. Of course a break to the upside would invalidate this. Also, as pointed out by CryptocCheck and many others, we have CME Gaps to the downside. Linked is the chart that inspired this one. This is not trading advice.
Trade active
Note
Still interestingOrder cancelled
Bull Train leaving station?Related publications
Disclaimer
The information and publications are not meant to be, and do not constitute, financial, investment, trading, or other types of advice or recommendations supplied or endorsed by TradingView. Read more in the Terms of Use.
Related publications
Disclaimer
The information and publications are not meant to be, and do not constitute, financial, investment, trading, or other types of advice or recommendations supplied or endorsed by TradingView. Read more in the Terms of Use.