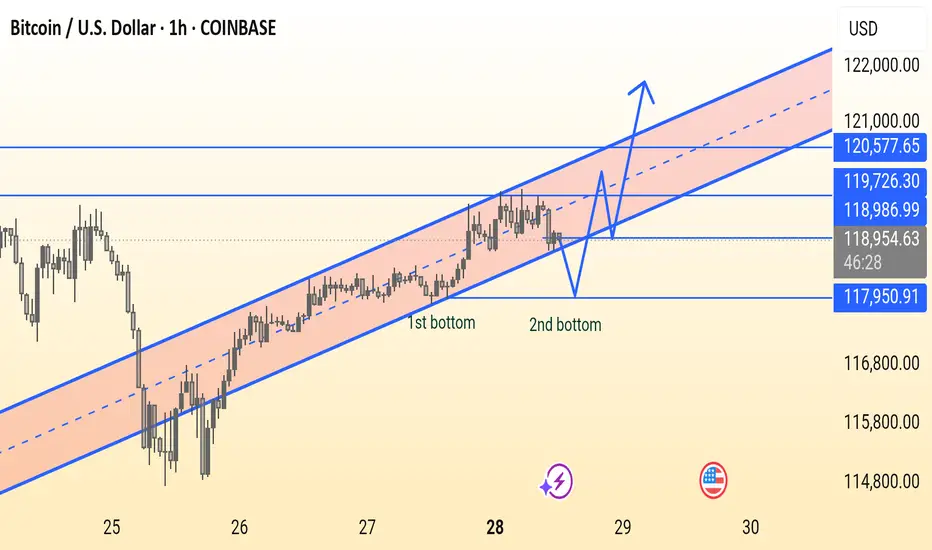
This BTC/USD 1-hour chart shows Bitcoin trading in an ascending channel, forming a potential double bottom near support around $118,950. A breakout above $118,986 could lead to a bullish move toward $120,577. Key support lies at $117,950 — holding this level is crucial for bullish continuation.
t.me/Forex_Gold_Signals117
Gold Free trades ❤️
kill gold every day with confirm signals ❤️
t.me/Forex_Gold_Signals117
Gold Free trades ❤️
kill gold every day with confirm signals ❤️
t.me/Forex_Gold_Signals117
Disclaimer
The information and publications are not meant to be, and do not constitute, financial, investment, trading, or other types of advice or recommendations supplied or endorsed by TradingView. Read more in the Terms of Use.
t.me/Forex_Gold_Signals117
Gold Free trades ❤️
kill gold every day with confirm signals ❤️
t.me/Forex_Gold_Signals117
Gold Free trades ❤️
kill gold every day with confirm signals ❤️
t.me/Forex_Gold_Signals117
Disclaimer
The information and publications are not meant to be, and do not constitute, financial, investment, trading, or other types of advice or recommendations supplied or endorsed by TradingView. Read more in the Terms of Use.