I have prepared two charts that contain both relevant variants.
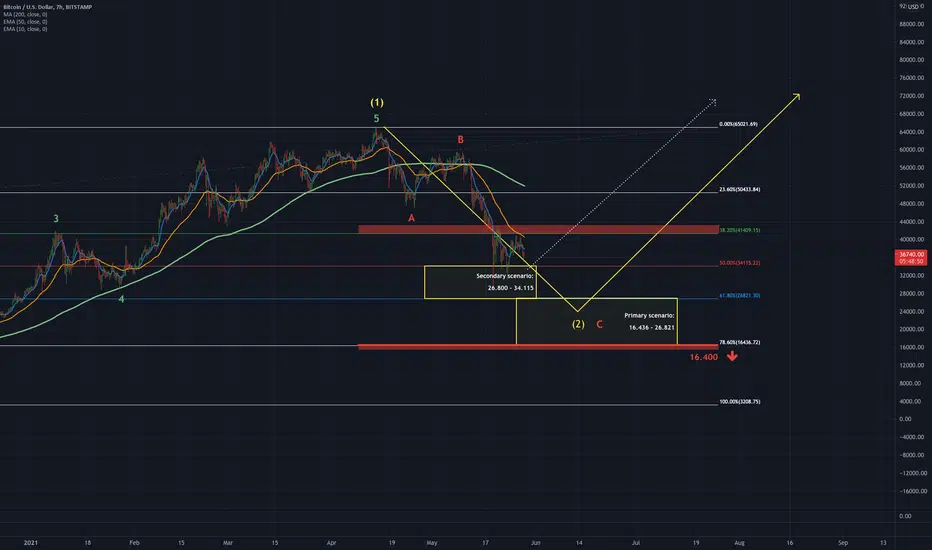
In the overall picture we are in a correction wave 2. The question is how far this can correct.
Alt. 1:
We have already seen the lows and are now starting another bullish wave 3.
Alt. 2 (which I find more likely):
Probability: 60%
--> we could see more lows. A correction in the range 16,400 - 26,245 is possible.
Weekly:
Disclaimer
The information and publications are not meant to be, and do not constitute, financial, investment, trading, or other types of advice or recommendations supplied or endorsed by TradingView. Read more in the Terms of Use.
Disclaimer
The information and publications are not meant to be, and do not constitute, financial, investment, trading, or other types of advice or recommendations supplied or endorsed by TradingView. Read more in the Terms of Use.