Yesterday’s analysis/position: Added to my short. Longs wicks on top of the last three candles have me feeling very confident about my position. Also selling spot this morning and afternoon.
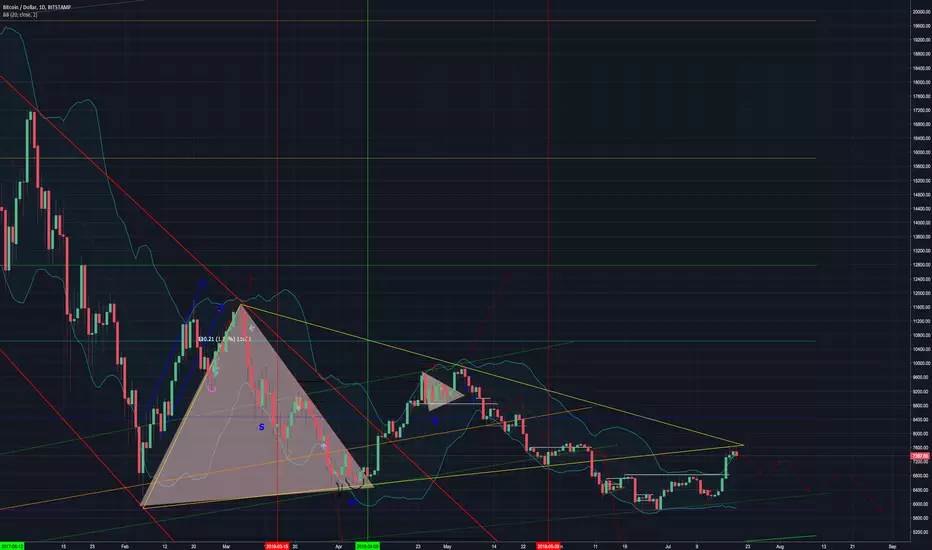
Patterns: Retesting bottom of triangle
Horizontal support and resistance: weak R: $7,340 strong R: $7,500 weak S: $7,300 (do not expect it to hold for much longer). Strong S: $6,800 and $6,200
BTCUSDSHORTS: At an area of support. 1st green candle in 3 days.
Funding Rates: longs pay 0.01% to shorts
12 & 26 EMA’s (calculate % difference): 12: +12.43% 26: +9.02% Just made bearish cross on 1h
MA crossovers (50 & 128): 50: +9.17% 128: -3.93% 128 serving as resistance like we expected
FIB’s: 0.382 = $8,476 0.236 = $5,817
Candlestick analysis: shooting star and spinning top at resistance on daily. Currently forming another shooting star. Multiple reversal dojis on 12h.
Ichimoku Cloud: Daily cloud served as resistance. Posturing for bullish TK cross. Do not believe it will amount to anything. C clamp on 3d is almost fully resolved. Bearish kumo twist on weekly.
TD Sequential: Green 1 following red 9 on weekly. Green 2 above a green 1 on the 3d. Green 5 on daily. Red 1 on 12h.
Visible Range: Volume at $7,300 and nothing more until $6,800. Resistance stacked from here to $8,700.
BTC Price Spreadsheet: 12h: -1.61% 1D: -1.34% 1W: +18.09% 2w: +9.10% 1m: +10.82%
Bollinger Bands: Last two candles closed outside of top band. First time this has happened since 9/1/17 when the price proceeded to correct -38.46% in 13 days (and that was in a bull market). MA on weekly is acting as resistance
Trendline: Coming from triangle. Next hyperwave will be at ~$5,000
Daily Trend: bearish
Fractals: 4 UP fractals broken on this recent move. Next one is at $7,800
On Balance Volume: following price
Buy/Sell Sentiment on Trading View: RSI: 64.3 Stoch: 85.9 Oscillators = sell MA’s = BUY
Conclusion: I have been selling spot all morning/afternoon and still have 25% leftover. I will be selling that the moment that we breakdown $7,275 support. From there a quick drop back to $6,800 is strongly expected. There will be a bounce from $6,800. That level served as strong resistance and will now attempt to turn into support. I do not expect it to hold for more than a day or two before we go for a retest of $6,200. My target for the bottom of this bear market is $4,250 on or around 8/30. If you are short and or selling spot then any of those three areas could be your profit target. Stop loss remains $7,826 and will be adjusted as soon as/if we break down $7,275 support.
emasar Indicator is available for purchase at alphanalysis.io/product/emasar/
Disclaimer
The information and publications are not meant to be, and do not constitute, financial, investment, trading, or other types of advice or recommendations supplied or endorsed by TradingView. Read more in the Terms of Use.