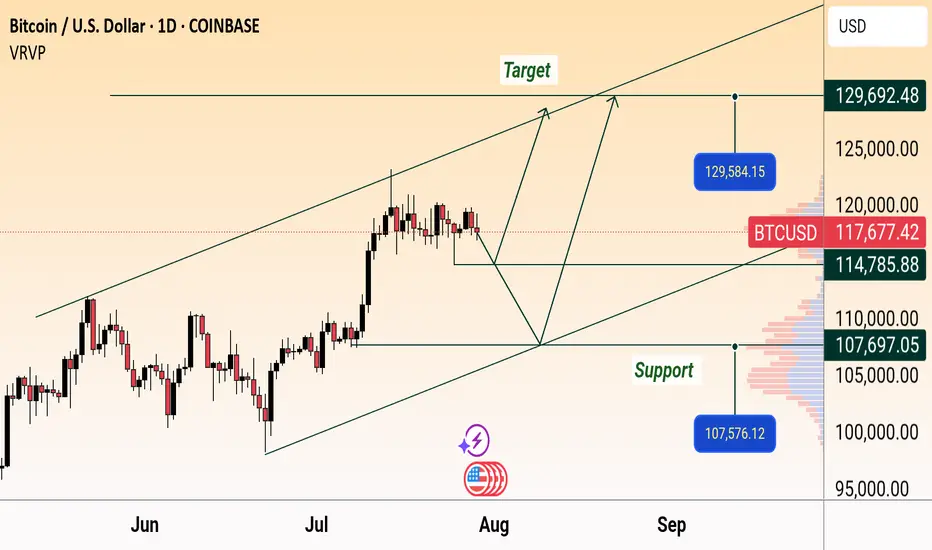
Bitcoin (BTC/USD) Daily Chart Analysis:
Price is currently at $117,758.70, showing a slight decline. Key support levels are marked at $114,785.88 and $107,576.12, while targets are projected near $129,584.15 and $129,692.48. Chart suggests a possible upward channel, with both bullish and bearish scenarios mapped.
Price is currently at $117,758.70, showing a slight decline. Key support levels are marked at $114,785.88 and $107,576.12, while targets are projected near $129,584.15 and $129,692.48. Chart suggests a possible upward channel, with both bullish and bearish scenarios mapped.
t.me/ForexExpert377
🔥 What You’ll Get:
✅ Daily Forex signals with high accuracy
✅ Technical & fundamental analysis
✅ Risk management tips to protect your capital
📩 Join now and start winning
t.me/ForexExpert377
🔥 What You’ll Get:
✅ Daily Forex signals with high accuracy
✅ Technical & fundamental analysis
✅ Risk management tips to protect your capital
📩 Join now and start winning
t.me/ForexExpert377
Disclaimer
The information and publications are not meant to be, and do not constitute, financial, investment, trading, or other types of advice or recommendations supplied or endorsed by TradingView. Read more in the Terms of Use.
t.me/ForexExpert377
🔥 What You’ll Get:
✅ Daily Forex signals with high accuracy
✅ Technical & fundamental analysis
✅ Risk management tips to protect your capital
📩 Join now and start winning
t.me/ForexExpert377
🔥 What You’ll Get:
✅ Daily Forex signals with high accuracy
✅ Technical & fundamental analysis
✅ Risk management tips to protect your capital
📩 Join now and start winning
t.me/ForexExpert377
Disclaimer
The information and publications are not meant to be, and do not constitute, financial, investment, trading, or other types of advice or recommendations supplied or endorsed by TradingView. Read more in the Terms of Use.