🔵 Building Liquidity: What it really means
🔹 How is liquidity built
🔹 How can you spot a Liquidity-building zone
🔹 Why do whales move the market in an orderly manner
🔹 Professionals never forget what they've built
🔹 From the chart above
🔴 Tips
Professional traders often need liquidity (buyers and sellers) to enter/exit large positions without moving the market too much.
This means manipulating the market within a pre-determined range, which serves as the operating center for everything that follows.
🔹 How is liquidity built
- Price Ranging: Sideways consolidation before big moves attracts both buyers and sellers.
- False Breakouts (Stop hunts): Price may briefly break support/resistance to trigger retail stop-losses and fill institutional orders.
- News Timing: Pro traders often execute during or just before major news when volatility brings liquidity.
🔹 How can you spot a Liquidity-building zone
🔸 Volume
- Unusual spikes in volume: Often indicate institutional activity.
- Volume clusters at ranges or breakouts: Suggest accumulation/distribution zones.
- Volume with price divergence: Price rises but volume falls = possible exhaustion. Volume rises and price consolidates = potential accumulation.
🔸 Price Action
- Order Blocks / Imbalance zones: Sharp moves followed by consolidations are often pro trader footprints.
- Break of Structure (BoS): Institutions often reverse trends by breaking previous highs/lows.
- Liquidity sweeps: Price moves aggressively above resistance or below support then reverses = stop-loss hunting.
🔸 News Reaction
- Watch pre-news volume spikes.
- Look for contrarian moves after news — when price moves opposite to expected direction, it often reveals smart money traps.
- Analyze price stability post-news — slow movement shows absorption by pros.
- Wick traps and reversals around news events = stop hunting.
🔸 Narrative is Everything
- Higher timeframe trends show intent.
- Lower timeframes show execution zones.
- Look for alignment between timeframes in a specific direction.
🔹 Why do whales move the market in an orderly manner
- To fill large positions at optimal prices.
- To create liquidity where there is none.
- To trap retail on the wrong side of the move.
- To trap other whales on the wrong side of this move.
- To rebalance portfolios around economic cycles/news.
🔹 Professionals never forget what they've built
When you track price, volume, and news, you’ll find specific bars that form areas that are the foundation for the short-term direction.
This is pure VPA/VSA logic, the interplay of Price Analysis ,Volume Analysis and News, where each bar is not just a bar , but a clue in the story that professionals are writing.
When you monitor volume, price, and news together and perform multi-timeframe analysis, it becomes clear what the whales are doing, and why.
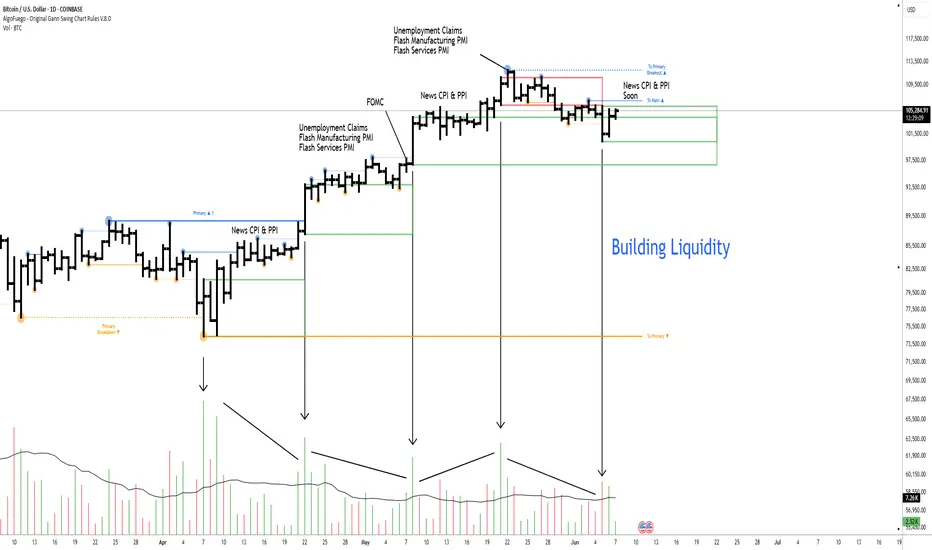
🔹 From the chart above
- The market reached a weekly resistance level and then pulled back slightly after whales triggered the stop-losses of breakout traders.
- Prior to the breakout, whales had accumulated positions by creating a series of liquidity-rich buying zones on the daily timeframe.
- It's essential to understand the broader context before choosing to participate alongside them—whether you're planning to buy or sell.
🔴 Tips
- Use volume and price analysis together, not separately.
- Monitor any unusual volume bars before economic market news.
- Monitor news and volatility spikes to detect traps and entries.
- Combine this with liquidity zones (support/resistance clusters).
- Build a "narrative" per week: What is smart money trying to do?
- A smart trader understands the tactics whales use, and knows how to navigate around them.
Note
🔹 Liquidity testingLiquidity testing is a market activity where large traders probe the market to assess the availability of liquidity at specific price levels. This means they check whether there are enough buy or sell orders around a certain price to execute large trades without causing excessive price movement.
This bar is chosen in advance (often because it shows unusually large range and volume), and within it the whale will place “traps” (large stop-orders or limit orders) to see if those orders fill.
🔹 How does liquidity testing relate to news events
Before or during major news releases, market volatility typically increases, and liquidity can fluctuate rapidly. Whales often use these moments to test liquidity by placing traps large orders designed to trigger stops or induce smaller traders to react. This allows them to:
- Identify where liquidity clusters (such as stop-loss orders or pending entries) are located around the news event.
- Exploit these liquidity pools to enter or exit positions with minimal slippage and better pricing.
- Influence price movements by triggering reactions from less informed traders reacting to the news.
Thus, liquidity testing is often strategically timed around important news events to maximize its effectiveness.
Liquidity testing helps large traders understand how much market depth exists around key price points, especially during volatile periods caused by news releases. This insight allows them to maneuver the market in their favor.
🔹 Why perform the test inside a Liquidity Bar
- Predetermined zone: The liquidity bar is identified beforehand as the candle with the highest concentration of potential stops or pending orders—i.e., where liquidity “pools” are most likely to sit.
- Controlled environment: By testing within one discrete bar, the trader confines market impact and can more accurately gauge true depth at those price extremes.
- Precision timing: This bar often immediately precedes or coincides with a news release, when liquidity naturally swells around key price levels.
🔹 What whales do
🔸 Pre-News buildup
Ahead of a scheduled announcement (News), order books often see clusters of stops or limit orders around round numbers or previous highs/lows.
🔸 Trap deployment
Whales place large orders within the liquidity bar’s range to “trigger” those stops once the news hits, exploiting the sudden influx of retail orders reacting to the headline.
🔸 Execution & extraction
When the news causes volatility, the liquidity test both flushes out smaller traders’ orders and ensures the whale can execute its own large position at favorable prices, minimizing slippage and potentially even moving the market in its favor.
🔹 From the chart below
- Whales have shown increased activity around the expected release of important news on June 11–12.
- Current market liquidity is likely to be tested through the placement of traps within the most recent liquidity zone.
Note
🔸 Bad news is good news.Comparing the spot price to the futures price reveals the true market sentiment.
🔹 BTC Spot
The previous liquidity zone was respected, and a new one has formed.
A bear trap emerged amid the Iran-Israel conflict and inflation news.
🔹 BTC Future
A fake supply event was triggered - coinciding with the news- to probe true market liquidity.
Get started with our premium tools: AlgoFuego.com ☄️
Disclaimer
The information and publications are not meant to be, and do not constitute, financial, investment, trading, or other types of advice or recommendations supplied or endorsed by TradingView. Read more in the Terms of Use.
Get started with our premium tools: AlgoFuego.com ☄️
Disclaimer
The information and publications are not meant to be, and do not constitute, financial, investment, trading, or other types of advice or recommendations supplied or endorsed by TradingView. Read more in the Terms of Use.