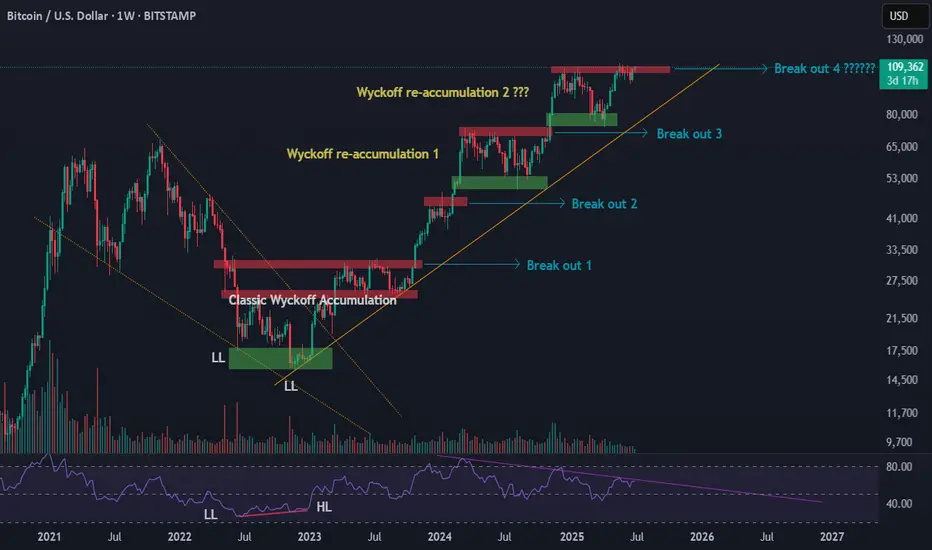
Over the past few months, I’ve been closely studying Bitcoin’s macro structure from June 2022 to June 2025, and I believe we’re witnessing a textbook example of Wyckoff theory unfolding in real time — not just once, but in multiple phases.
🔍 Phase 1: Classic Wyckoff Accumulation (June 2022 – Oct 2023)
Starting June 2022, BTC began forming a major bottoming structure.
By November 2022, price made a lower low — but RSI (14) was making higher lows, a clear sign of bullish divergence.
From there until October 2023, BTC moved sideways in a Wyckoff accumulation range.
This was Phase A–E in classic Wyckoff terms:
Selling Climax (SC)
Secondary Test (ST)
Spring (false breakdown)
Last Point of Support (LPS)
Sign of Strength (SOS)
🚀 Phase 2: Markup with Re-Accumulations at Each Leg
After the October 2023 breakout, BTC has followed a highly structured rally with multiple consolidation phases and healthy corrections:
✅ Breakout 1:
From ~$31K to $48K → +53% move
Followed by a ~20% pullback to ~$38K
➜ This formed a re-accumulation phase, consolidating above prior resistance
✅ Breakout 2:
From $38K to $73K → +50% move
Then a deeper ~31% correction to ~$50K
✅ Breakout 3:
From $50K to $109K → +48% move
Current pullback to ~$74K → ~31% retracement
Now trading near ATH region again
🧠 Key Observation
In this cycle, we’re seeing not only one accumulation at the bottom, but also clear Wyckoff Re-Accumulation zones forming after each breakout, especially after Breakouts 1 and 3.
This suggests institutional accumulation continues during the trend, supporting the idea that:
Pullbacks are for re-loading, not distribution
Trend strength remains intact as long as prior re-accumulation lows hold
🧭 What This Means for the Current Cycle
If this structure continues, BTC may be preparing for another markup leg above $110K
Historical fractals from past bull markets (e.g., 2020–2021) show similar behavior
RSI structure and market rhythm continue to favor trend continuation, not exhaustion
📌 Conclusion
We are likely in the mid-to-late phase of a well-structured bull market, supported by:
Wyckoff Accumulation at the bottom
Re-Accumulations after each breakout
Healthy 20–31% pullbacks
RSI confirming internal strength
🔔 Next levels to watch:
Support: $74K, $88K
Resistance: $111K–$115K
Breakout target (if pattern continues): $145K–$175K zone
📢 Let me know what you think!
Do you see similar Wyckoff structure?
Drop your thoughts or charts below 👇
#BTC #Bitcoin #Wyckoff #CryptoTA #TradingView #BTCAnalysis #Reaccumulation #RSI #BullMarket
Disclaimer
The information and publications are not meant to be, and do not constitute, financial, investment, trading, or other types of advice or recommendations supplied or endorsed by TradingView. Read more in the Terms of Use.
Disclaimer
The information and publications are not meant to be, and do not constitute, financial, investment, trading, or other types of advice or recommendations supplied or endorsed by TradingView. Read more in the Terms of Use.