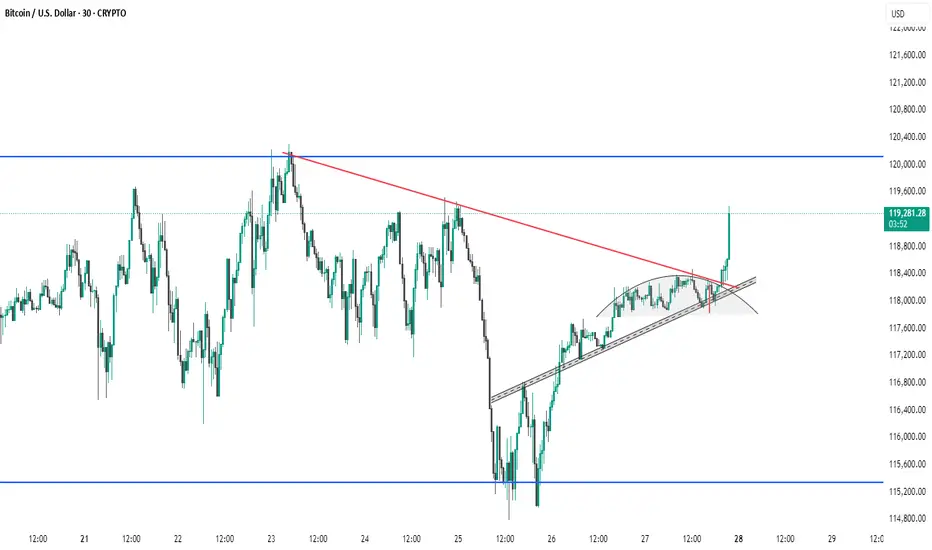
This Bitcoin (BTC/USD) 30-minute chart shows a recent breakout above a descending trendline (red) and an ascending wedge pattern. Price has broken out of a rounding structure, indicating a potential bullish reversal. The breakout candle is strong, suggesting bullish momentum. Key resistance lies near 120,000 (blue horizontal line), while support is around 115,600. Watch for confirmation of the breakout with volume or a retest of the breakout level for sustained upward movement.
thanking you
thanking you
Related publications
Disclaimer
The information and publications are not meant to be, and do not constitute, financial, investment, trading, or other types of advice or recommendations supplied or endorsed by TradingView. Read more in the Terms of Use.
Related publications
Disclaimer
The information and publications are not meant to be, and do not constitute, financial, investment, trading, or other types of advice or recommendations supplied or endorsed by TradingView. Read more in the Terms of Use.