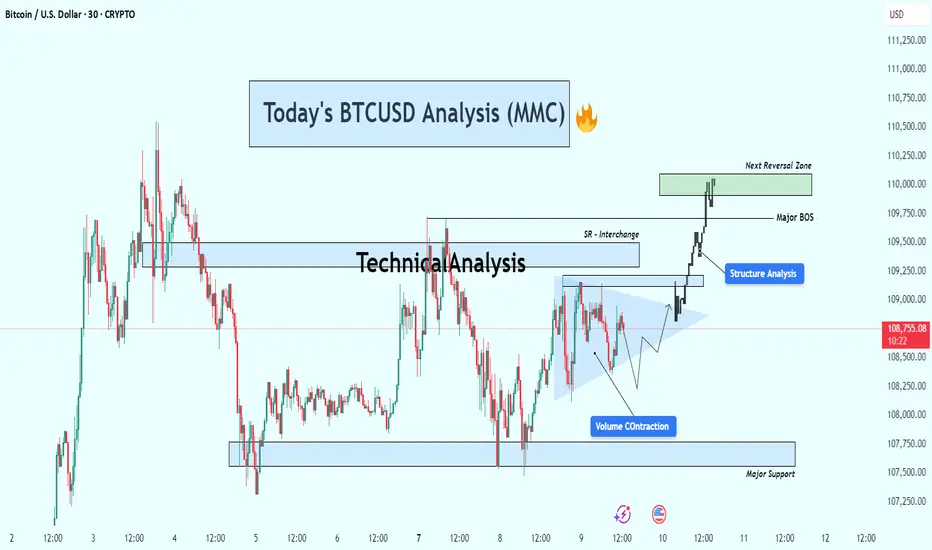
Bitcoin (BTC/USD) is currently trading around $108,700, showing strong bullish momentum after breaking out of a consolidation structure. Price action has shifted significantly, with clear structural developments pointing toward continued upside — but not without caution around the next reversal zone.
🔍 Key Technical Insights:
🔹 1. Volume Contraction Triangle (Bullish Breakout)
The chart initially shows a volume contraction pattern forming a symmetrical triangle.
This pattern is often associated with market compression — a setup where smart money accumulates before a breakout.
BTC broke out of the triangle with strong bullish candles, confirming buyers have stepped in with conviction.
🔄 2. Structure Shift & Break of Structure (BOS)
A major BOS (Break of Structure) occurred as price broke previous swing highs, confirming a bullish market structure.
This BOS zone now acts as a potential support area if BTC pulls back.
A short-term SR interchange zone (Support becomes Resistance) was also respected and flipped again to support during the breakout — a clear sign of structural strength.
🧭 3. Next Reversal Zone – Supply in Sight
Price is approaching a major supply/reversal zone between $109,750 and $110,250.
This zone has previously shown strong selling interest.
Traders should watch for rejection or continuation patterns within this zone — such as bearish divergence, exhaustion candles, or confirmation of resistance.
🛡 4. Major Support Level
Below current price, a major support zone around $107,500–$107,800 remains intact.
This zone has provided a solid base during past consolidations and would be the first area of interest for buyers if a retracement occurs.
📌 Strategy Plan:
🔼 For Bullish Traders:
Those already in the breakout can hold with targets toward $110,000–$110,250.
If not in yet, wait for a retest of BOS/SR zone (~$109,000) for a safer re-entry.
Consider partial take-profits within the green reversal zone.
🔽 For Bearish Traders:
Watch for price exhaustion or a fake breakout in the reversal zone.
Potential short setups could form only if price fails to hold above the BOS zone and prints a lower high.
🔧 Technical Summary:
✅ Structure: Bullish Break of Structure confirmed
🔺 Momentum: Strong upside following volume contraction
📍 Next Key Resistance: $110,000–$110,250
📉 Major Support: $107,500–$107,800
⚠️ Caution Zone: Reversal area ahead – watch price action closely
Conclusion :
Bitcoin looks set to challenge the $110K psychological level as buyers remain in control. However, the reversal zone above is critical. A clean break and hold above it could open doors to further highs, while rejection here may trigger short-term pullbacks or range-bound conditions.
For Daily Trade Setups and Forecast: 📈 t.me/xauusdoptimizer
Premium Signals Fr33: 💯 t.me/xauusdoptimizer
🥰🥳🤩
Premium Signals Fr33: 💯 t.me/xauusdoptimizer
🥰🥳🤩
Related publications
Disclaimer
The information and publications are not meant to be, and do not constitute, financial, investment, trading, or other types of advice or recommendations supplied or endorsed by TradingView. Read more in the Terms of Use.