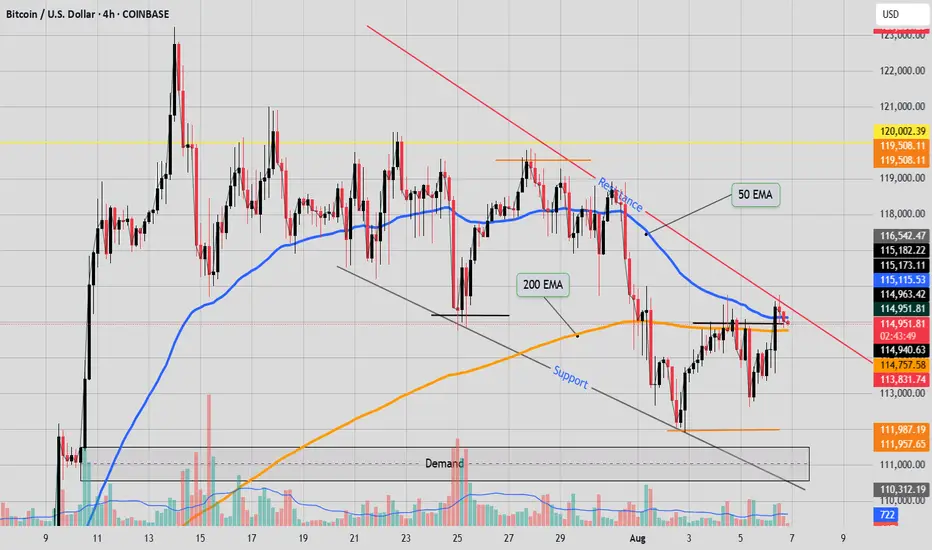
technical analysis (TA) on this Bitcoin/USD 4-hour chart highlights several key elements:
- **Trendlines & Structure**: There is a prominent descending red trendline marking current resistance, showing that price has been consistently rejected at lower highs.
- **Moving Averages**: the plotted the 50-period (blue) and 200-period (orange) moving averages. The price recently attempted to break above both, which typically signals a test of momentum; however, rejection suggests bearish pressure still dominates.
- **Support & Resistance**: Horizontal levels are marked for resistance (~115,173-115,114) and support below (~113,832). These zones align with previous price reactions.
- **Demand & Supply**: the labeled demand zone between roughly 110,312 to 111,957, where buying interest has previously stepped in, evidenced by higher trading volumes in that area.
- **Volume**: Enhanced volume is seen around the demand zone, supporting its strength. Decreasing volume during recoveries hints at weakening buyer conviction on upswings.
- **Market Structure**: Price is trading under the major moving averages and below both the structural resistance and trendline, indicating bears remain in control unless a breakout occurs above these levels.
In summary, the chart analysis conveys that Bitcoin is still in a bearish structure, struggling to regain momentum above key resistance and trendlines, with strong demand only expected in the lower highlighted box. Bulls need a decisive breakout above the descending red trendline and major moving averages to shift the narrative. (Perplexity and me)
Disclaimer
The information and publications are not meant to be, and do not constitute, financial, investment, trading, or other types of advice or recommendations supplied or endorsed by TradingView. Read more in the Terms of Use.
Disclaimer
The information and publications are not meant to be, and do not constitute, financial, investment, trading, or other types of advice or recommendations supplied or endorsed by TradingView. Read more in the Terms of Use.