Hi guys. yes, we had a spark up! one thing i am doing, after some weeks now, is that i have two bitmex accounts. one for short, one for long position. so i went long with ETH, 171 dollars, sold many of portion at 191 dollars. for shorts, i am swing trading it, opened more upper 63 level, and 6430, plan to open more at 65 and 66 if, it comes. so i will make this quick for today. it does feel good btc spikes up. I REALLY DO NOT WANT TO SEE 5K, OR 4.9K, SO SO SO BEARISH, if we dip that much we would not have a good bounce even in the end of the year.

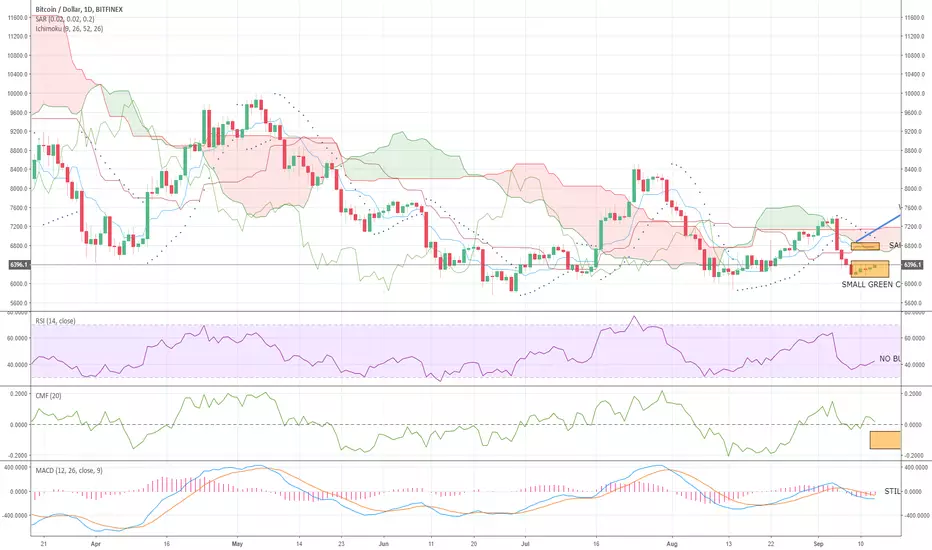
so easy daily chart. major resistance if we go up 6450, we have 6590(21EMA), and 6800ish(50MA). so mostly likely a heavy correction comes, when btc sparks up even with good bull divergence at these areas.
i would think that, btc can give a heavy correction now, from 6400ish, since heavy bear divergence is printed out here. but, it can also spark to 65 zone or high even without that. so these areas are long position sell targets also short position entry targets. directional movement, still downtrend, not much to say. last time in august we had same kind of dirty up and down triangle formation, it went straight to 59 after making a higher high, with an evening star candle. so be careful.

weekly chart there are about 4 scenarios, that will close in this coming week.
1. we go sideways 63~65, close there->more drop incoming,bearish
2. we close this over 67(still indecision, but making bullishness), we close over 69(yes bullish)
3. we correct to 59, come back up and close at 63~65(still bearish, maybe more room to go up short term, we need to see)
4.we close below 63->bearish
normally, when we have a bearish engulfing candle, and we want to make bullishness, we needs to close more than at least 50% of the bearish engulfing candle to be better off. for now, yes, still not confirmed with anything, we need to see.

so looking for some indicators. parabolic SAR still says that downtrend is not over, but we might have tk cross, which is bullish, it will happen if we go up 65,66 stabilize. however, ichimoku clouds, bearish, we need to see. big resistance now. macd still confirming downtrends, cmf i think it needs to test more bottom levels.

short term, we see that heavy resistance 4hr 50MA is 6455, we just tried to surpass that we failed for now. so correction could come,if we do not go over that. bear divergence still in play, very bearish next target is 6590/6600. if that does not happen we have a chance to fall right to 59 zone, low of daily bollinger band. 4hr also has heavy ichimoku clouds at 65zone now.
so short term trades, we have to see, right now opening longs for swing trade is not recommended, but shorts, yes do open them at 64 zone, and 65 zone in coming days. that means i still think the bottom is not put in for btc, it still needs to retest 61, or 59,
to confirm some divergence. also, the candle sticks, volume does not confirm that 61 was the bottom. we need a bullish hammer or pin bar at 4hr or daily to confirm a reversal.
now, my trading plans are
1. open shorts
64, 65, 66~68.
-if you have already opened at 63 zone and 64 leave that. you should have only invested about 25~30% percent of your money. leave 65~70% for upper zone. invest about 30% at 65~66, it should be the top i think, but always leave 30% for 67~68, we never know. this is a swing trade, wait with patience. we will target at least more than 400 dollar points profit with this.
target:6100/5950,6000
2. open longs
for short term.
open longs 6290~6310
sell:6350/80/64.1~2/65+@
->if the spike only goes to 63.5 or 63.8, need to sell right away
i strongly recommend to go long or short on alts now, eth, or cardano, can be good bet.i think, ETH is confirming bullish good patterns here, eth can be better to go long at 170ish, or low 180dollars, scalping to 190ish, or even over 210~220 dollars, with about 20%~30% of your money. i will check.
btc,long term opening long term entries will be 5950, or even below, this needs to be observed.
that is about it, have a good one today!!
so easy daily chart. major resistance if we go up 6450, we have 6590(21EMA), and 6800ish(50MA). so mostly likely a heavy correction comes, when btc sparks up even with good bull divergence at these areas.
i would think that, btc can give a heavy correction now, from 6400ish, since heavy bear divergence is printed out here. but, it can also spark to 65 zone or high even without that. so these areas are long position sell targets also short position entry targets. directional movement, still downtrend, not much to say. last time in august we had same kind of dirty up and down triangle formation, it went straight to 59 after making a higher high, with an evening star candle. so be careful.
weekly chart there are about 4 scenarios, that will close in this coming week.
1. we go sideways 63~65, close there->more drop incoming,bearish
2. we close this over 67(still indecision, but making bullishness), we close over 69(yes bullish)
3. we correct to 59, come back up and close at 63~65(still bearish, maybe more room to go up short term, we need to see)
4.we close below 63->bearish
normally, when we have a bearish engulfing candle, and we want to make bullishness, we needs to close more than at least 50% of the bearish engulfing candle to be better off. for now, yes, still not confirmed with anything, we need to see.
so looking for some indicators. parabolic SAR still says that downtrend is not over, but we might have tk cross, which is bullish, it will happen if we go up 65,66 stabilize. however, ichimoku clouds, bearish, we need to see. big resistance now. macd still confirming downtrends, cmf i think it needs to test more bottom levels.
short term, we see that heavy resistance 4hr 50MA is 6455, we just tried to surpass that we failed for now. so correction could come,if we do not go over that. bear divergence still in play, very bearish next target is 6590/6600. if that does not happen we have a chance to fall right to 59 zone, low of daily bollinger band. 4hr also has heavy ichimoku clouds at 65zone now.
so short term trades, we have to see, right now opening longs for swing trade is not recommended, but shorts, yes do open them at 64 zone, and 65 zone in coming days. that means i still think the bottom is not put in for btc, it still needs to retest 61, or 59,
to confirm some divergence. also, the candle sticks, volume does not confirm that 61 was the bottom. we need a bullish hammer or pin bar at 4hr or daily to confirm a reversal.
now, my trading plans are
1. open shorts
64, 65, 66~68.
-if you have already opened at 63 zone and 64 leave that. you should have only invested about 25~30% percent of your money. leave 65~70% for upper zone. invest about 30% at 65~66, it should be the top i think, but always leave 30% for 67~68, we never know. this is a swing trade, wait with patience. we will target at least more than 400 dollar points profit with this.
target:6100/5950,6000
2. open longs
for short term.
open longs 6290~6310
sell:6350/80/64.1~2/65+@
->if the spike only goes to 63.5 or 63.8, need to sell right away
i strongly recommend to go long or short on alts now, eth, or cardano, can be good bet.i think, ETH is confirming bullish good patterns here, eth can be better to go long at 170ish, or low 180dollars, scalping to 190ish, or even over 210~220 dollars, with about 20%~30% of your money. i will check.
btc,long term opening long term entries will be 5950, or even below, this needs to be observed.
that is about it, have a good one today!!
Note
Note
Guys add short at 65.3/65.8/66zone. Now 21ema daily is at 6614 at the moment i dont think it eill go over that but incase dor that prepare 6680~6700level.it will go to 63 for retracement we can sell thete take some profits and see if it will try upper levels.Note
Disclaimer
The information and publications are not meant to be, and do not constitute, financial, investment, trading, or other types of advice or recommendations supplied or endorsed by TradingView. Read more in the Terms of Use.
Disclaimer
The information and publications are not meant to be, and do not constitute, financial, investment, trading, or other types of advice or recommendations supplied or endorsed by TradingView. Read more in the Terms of Use.