There is noticeable difference between a BITFINEX and a BITSTAMP 4h chart.
Bitfinex:
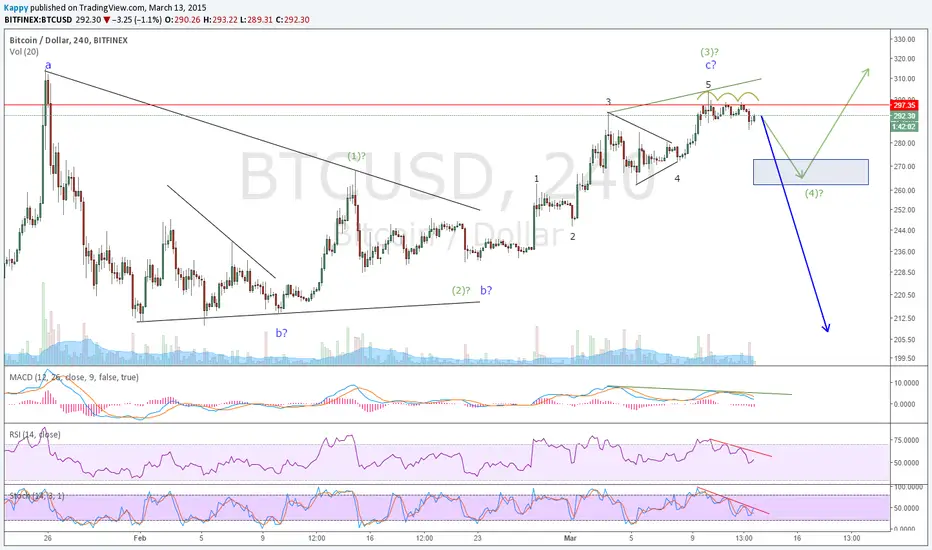
Divergences on RSI and Stochastic suggests the bullish outlook has weakened while prices moved sideways on the 4 hour chart
MACD divergence shows momentum has weakened from wave 3 to 5. Another short-term bearish signal.
Bitfinex:
- triple top is flat
- wave 1 does not overlap wave 4 (blending the 2 exchanges price does not overlap therefore, I consider this a valid 5 wave count)
- see user chessnut's 4h BITSTAMP chart linked in related ideas below
Divergences on RSI and Stochastic suggests the bullish outlook has weakened while prices moved sideways on the 4 hour chart
MACD divergence shows momentum has weakened from wave 3 to 5. Another short-term bearish signal.
Related publications
Disclaimer
The information and publications are not meant to be, and do not constitute, financial, investment, trading, or other types of advice or recommendations supplied or endorsed by TradingView. Read more in the Terms of Use.
Related publications
Disclaimer
The information and publications are not meant to be, and do not constitute, financial, investment, trading, or other types of advice or recommendations supplied or endorsed by TradingView. Read more in the Terms of Use.