#Bitcoin Technical Analysis:-
 BTC currently trading at $20300
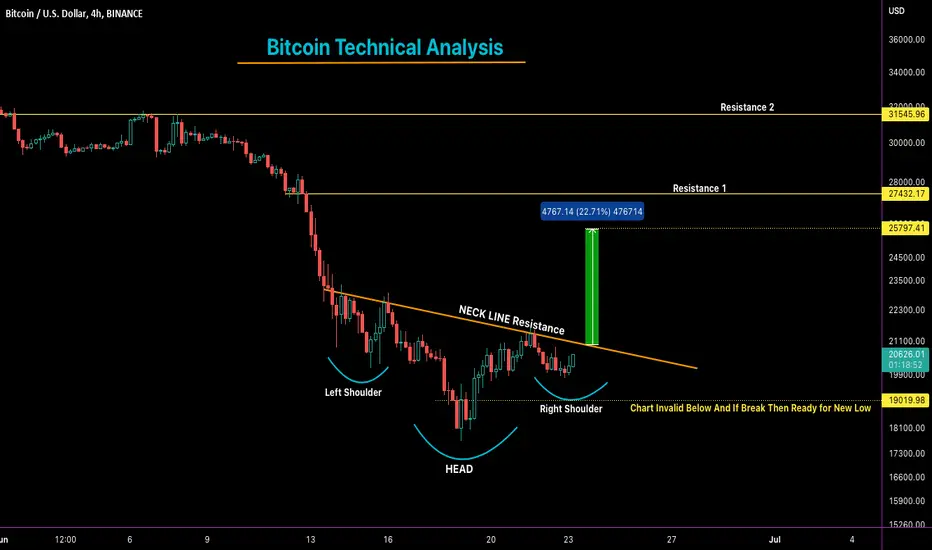
BITCOIN Forming Inverse Head & Shoulder Pattern in Lower Time Frame.
As Per Chart Inverse H&S Pattern Neck Line Resistance Is $21000
So If Any 4 Hours Candle close above $21400 then Target would be $25800-$27400
Chart Only Invalidate below $19000 support.
So If Break $19000 then We can see More Downside move and May Test New Low but Only if Break $19000 support.
Upper side Resistance which will be Targets:- $25800/$27400/$31500
Support:- $19900/$19000/$17600
If #Bitcoin Hold $19000 Level that’s mean Bottom We have Seen.
Trade active
#Bitcoin Inverse H&S Pattern Breakout:-
Inverse H&S Pattern Breakout $21k = ✅
So Now #BTC Target is $25800/$27400/$31500
Hope you are happy because of My #BTCUSDT Long Positon in 20% Profit.
New SL:- $19700 ( If 4H candle Close Below)
Twitter: twitter.com/CryptoPatel
Telegram: t.me/OfficialCryptoPatel
Instagram: instagram.com/cryptopatel?utm_medium=copy_link
Telegram: t.me/OfficialCryptoPatel
Instagram: instagram.com/cryptopatel?utm_medium=copy_link
Related publications
Disclaimer
The information and publications are not meant to be, and do not constitute, financial, investment, trading, or other types of advice or recommendations supplied or endorsed by TradingView. Read more in the Terms of Use.