Breakout Opportunities
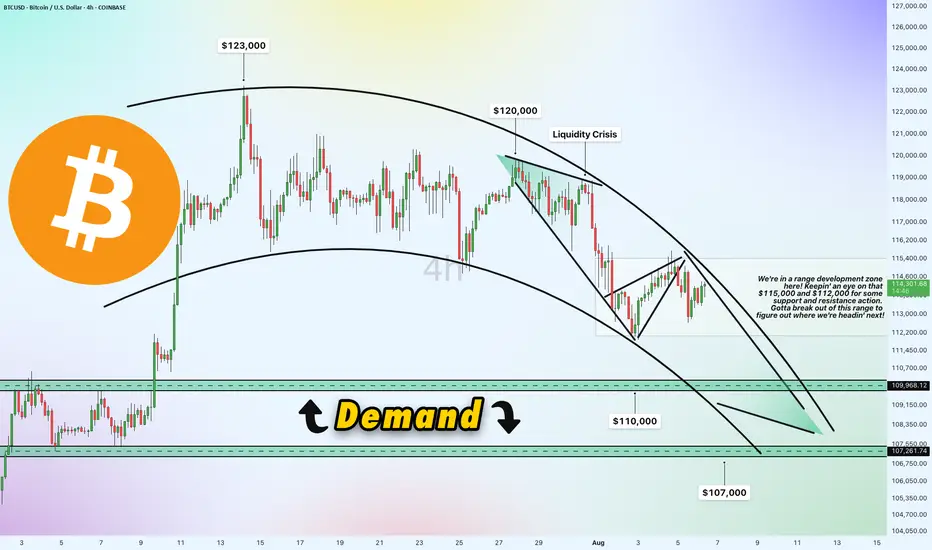
We're in a range development zone here! The chart shows Bitcoin (BTC/USD) trading within a tight range, with key levels at $115,000 and $112,000 acting as critical support and resistance zones. The price recently peaked near $123,000 but has since pulled back, forming a liquidity crisis zone around $120,000 where selling pressure kicked in. A breakout above $115,000 could signal a move toward $120,000 or higher, while a drop below $112,000 might push it toward the demand zone. Gotta break out of this range to figure out where we're headin' next!

Demand Zone
$110,000 & $107,000
Price slipped down from $120,000 due to a lack of buying liquidity, potentially it will land into a demand zone between $110,000 and $107,000. This area could act as a strong support level where buyers might step in. If the price holds here, it could bounce back toward the $112,000-$115,000 range. However, a failure to hold this zone might see it test lower support around $107,000 or even $105,000.
Direction and Possible Ranges
Keep an eye on these levels for the next big move!
We're in a range development zone here! The chart shows Bitcoin (BTC/USD) trading within a tight range, with key levels at $115,000 and $112,000 acting as critical support and resistance zones. The price recently peaked near $123,000 but has since pulled back, forming a liquidity crisis zone around $120,000 where selling pressure kicked in. A breakout above $115,000 could signal a move toward $120,000 or higher, while a drop below $112,000 might push it toward the demand zone. Gotta break out of this range to figure out where we're headin' next!
Demand Zone
$110,000 & $107,000
Price slipped down from $120,000 due to a lack of buying liquidity, potentially it will land into a demand zone between $110,000 and $107,000. This area could act as a strong support level where buyers might step in. If the price holds here, it could bounce back toward the $112,000-$115,000 range. However, a failure to hold this zone might see it test lower support around $107,000 or even $105,000.
Direction and Possible Ranges
Upward Potential: If Bitcoin breaks above $115,000 with strong volume, the next targets could be $120,000 (liquidity crisis zone) and potentially $123,000, aligning with recent highs. A sustained move above $120,000 might open the door to $125,000 or beyond.
Downward Risk: Should the price fail to hold above $112,000 and break below, it could slide into the demand zone ($110,000-$107,000). Further weakness might push it toward $105,000, a psychological and technical support level.
Current Trend: The chart shows a descending trendline from the $123,000 peak, suggesting bearish pressure unless a decisive breakout occurs. The 4-hour timeframe indicates indecision, with the range-bound action hinting at a potential volatile move once direction is confirmed.
Keep an eye on these levels for the next big move!
Trade active
Price ripped through the resistance of $115,000, now it's open road to the $120,000 📲 Join Telegram Trading Community: t.me/+5hlxWmhHaKplN2Rk
🎙️ 𝘾𝙊𝙈𝙄𝙉𝙂 𝙎𝙊𝙊𝙉 Daily Live Streams on 🔴 𝗬𝗼𝘂𝗧𝘂𝗯𝗲
🔍 linktr.ee/artemcrypto ✅
🎙️ 𝘾𝙊𝙈𝙄𝙉𝙂 𝙎𝙊𝙊𝙉 Daily Live Streams on 🔴 𝗬𝗼𝘂𝗧𝘂𝗯𝗲
🔍 linktr.ee/artemcrypto ✅
Disclaimer
The information and publications are not meant to be, and do not constitute, financial, investment, trading, or other types of advice or recommendations supplied or endorsed by TradingView. Read more in the Terms of Use.
📲 Join Telegram Trading Community: t.me/+5hlxWmhHaKplN2Rk
🎙️ 𝘾𝙊𝙈𝙄𝙉𝙂 𝙎𝙊𝙊𝙉 Daily Live Streams on 🔴 𝗬𝗼𝘂𝗧𝘂𝗯𝗲
🔍 linktr.ee/artemcrypto ✅
🎙️ 𝘾𝙊𝙈𝙄𝙉𝙂 𝙎𝙊𝙊𝙉 Daily Live Streams on 🔴 𝗬𝗼𝘂𝗧𝘂𝗯𝗲
🔍 linktr.ee/artemcrypto ✅
Disclaimer
The information and publications are not meant to be, and do not constitute, financial, investment, trading, or other types of advice or recommendations supplied or endorsed by TradingView. Read more in the Terms of Use.