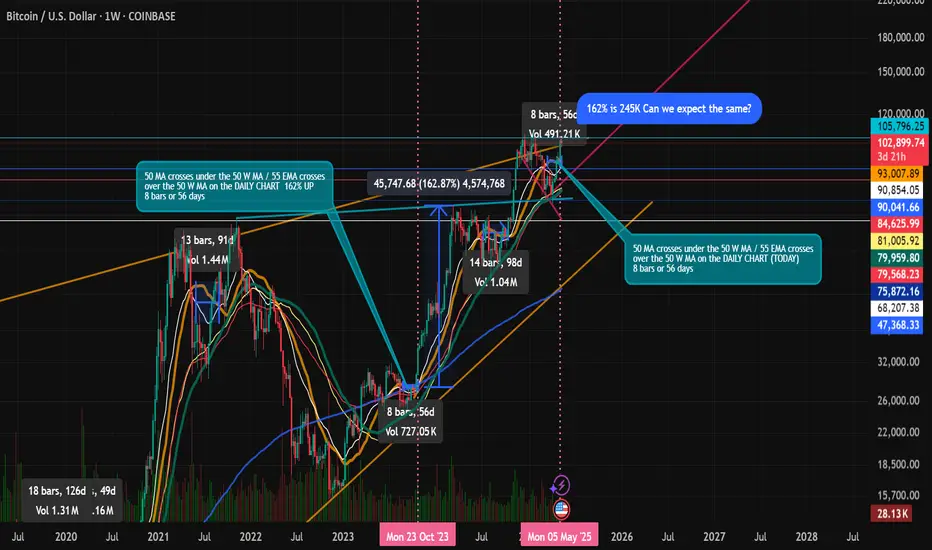
The last time that the 50 Day MA crossed under the 50 Week MA and the then the 55 EMA crossed over the 55 EMA it took 8 bars or 56 days. This move led to about a 162% gain.
The same thing just happened today, the 56th day within 8 bars, the 55 EMA crossing over the 50 Week MA. The Stoc RSI, RSI, and MACD are near the same or very similar values.
Will history repeat?
Disclaimer
The information and publications are not meant to be, and do not constitute, financial, investment, trading, or other types of advice or recommendations supplied or endorsed by TradingView. Read more in the Terms of Use.
Disclaimer
The information and publications are not meant to be, and do not constitute, financial, investment, trading, or other types of advice or recommendations supplied or endorsed by TradingView. Read more in the Terms of Use.