📊 Bitcoin Daily – Probabilistic Swing in Play
Tracking the Snap Zone & Energy Reset
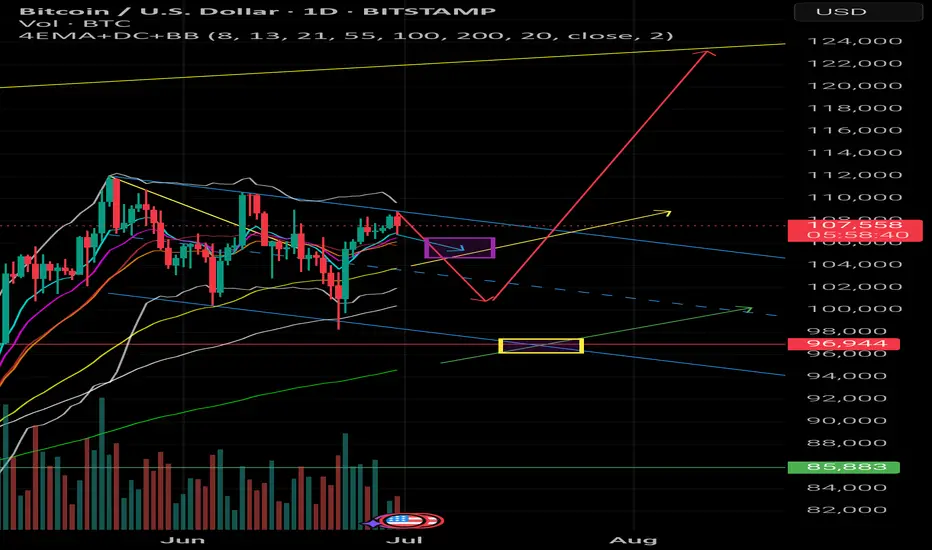
I’m watching a probabilistic swing scenario on Bitcoin where the price might need to dive into the 100k - 101k zone to build enough energy for the next major move.
The key area I’m tracking is the EMA 200 on the daily chart (~95k - 97k).
This would be the natural deep target if the price sweeps lower. The EMA 200 often acts as a long-term support where markets "reset" and gather strength.
👉 It’s also worth noting: Institutional traders traditionally view the daily EMA 200 as a key buy zone in an overall bullish market structure.
That’s where many large players reload positions, aiming to ride the next expansion wave.
What I’m expecting:
A retracement into 100k - 101k to snap the short EMAs together.
A potential liquidity sweep below the EMA 100, possibly down to the EMA 200 zone.
Key bullish signals: wick rejections, strong bounce candles, and engulfing patterns on the 4h or daily.
This would set up the energy for a clean bounce and a probable move towards the upper yellow trendline around 124k.
Without this deeper retracement, the move would likely run out of steam earlier, probably capping out around 112k.
I trade probabilistic scenarios based on natural price swings, EMA wave dynamics, and energy compression zones.
📌 Chart and path idea attached.
What’s your view? Are you watching this zone?
Tracking the Snap Zone & Energy Reset
I’m watching a probabilistic swing scenario on Bitcoin where the price might need to dive into the 100k - 101k zone to build enough energy for the next major move.
The key area I’m tracking is the EMA 200 on the daily chart (~95k - 97k).
This would be the natural deep target if the price sweeps lower. The EMA 200 often acts as a long-term support where markets "reset" and gather strength.
👉 It’s also worth noting: Institutional traders traditionally view the daily EMA 200 as a key buy zone in an overall bullish market structure.
That’s where many large players reload positions, aiming to ride the next expansion wave.
What I’m expecting:
A retracement into 100k - 101k to snap the short EMAs together.
A potential liquidity sweep below the EMA 100, possibly down to the EMA 200 zone.
Key bullish signals: wick rejections, strong bounce candles, and engulfing patterns on the 4h or daily.
This would set up the energy for a clean bounce and a probable move towards the upper yellow trendline around 124k.
Without this deeper retracement, the move would likely run out of steam earlier, probably capping out around 112k.
I trade probabilistic scenarios based on natural price swings, EMA wave dynamics, and energy compression zones.
📌 Chart and path idea attached.
What’s your view? Are you watching this zone?
Disclaimer
The information and publications are not meant to be, and do not constitute, financial, investment, trading, or other types of advice or recommendations supplied or endorsed by TradingView. Read more in the Terms of Use.
Disclaimer
The information and publications are not meant to be, and do not constitute, financial, investment, trading, or other types of advice or recommendations supplied or endorsed by TradingView. Read more in the Terms of Use.