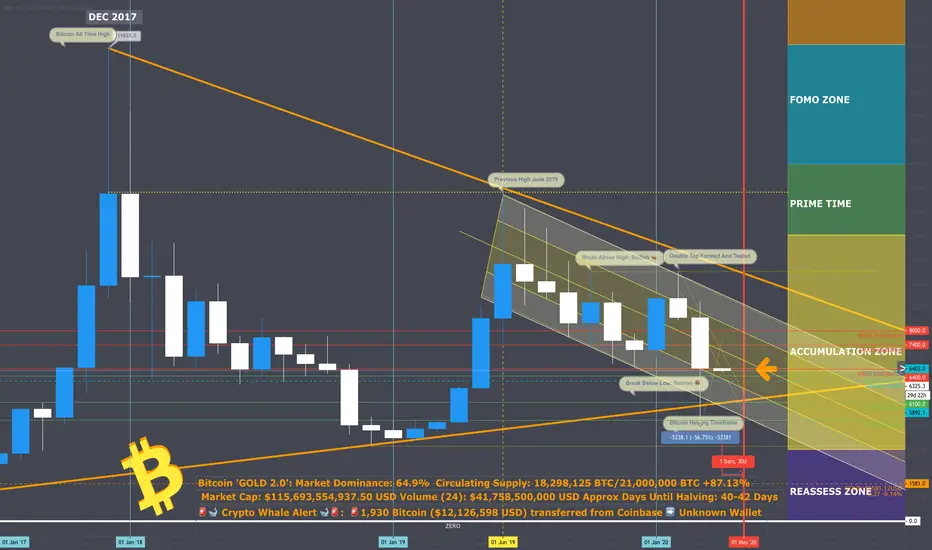
Bitcoin ‘GOLD 2.0’ Overview: Last month saw bitcoin have a price range of over $5200 to the south in its candle movement. Price since Jun 2019 has been in a steady downward channel and where this months candle open the next 30 days needs to show straight to the mid part to give confidence to the Bulls. A break above 7400 will be the mid zone and have broken some rather large resistance areas.
There’s a lot off downward pressure here especially with the current world economics transpiring. The lower trend line from 2017/2019 will see price contend with, this will act as solid support as its already been tested. If it breaks during this month we could see a downside of 61200 or lower. This month of April will be an interesting one to say the least, happy trading
Support Levels: 6100 is Support
Resistance Levels: 6400 is Resistance still until a close happens above it
Point of Interest: Current price level. We either move to the mid of this downward channel or fall tot eh lower channel line and trend line.
🐃Bulls Verse Bears🐻
Bullish above 10500
Bearish below 6500
Bitcoin to Date:
Overall
Approximate Bitcoin Dominance: 64.9%
Approximate Bitcoin in Circulation: 18,298,125 BTC
Approximate Bitcoin Left to Mine: 2,701,875 BTC
Road to 21,000,000 Bitcoin Mined: 87.13%
Approximate Days Until Halving: 40-42 Days
Daily
Current Price: $6316 USD
Daily Change %: -1.74%
Market Cap: $115,693,554,937.50 USD
24 Hour Volume: $41,758,500,000 USD
Population of the World: ~7,774,720,300+ humans
Bitcoin/World Population: ~ 0.002353541258584 Satoshi’s / $14.86 USD per person
Trading Quote
“If most traders would learn to sit on their hands 50 percent of the time, they would make a lot more money.” – Bill Lipschutz
GOLD: $1581 USD —2.52 -0.15% Gold has fallen $2.5 USD within the day.
Biggest Bitcoin Transactions of the Day
🚨 896 Bitcoin ($5,749.854 USD) transferred from Xapo ➡️ Unknown Wallet
Related publications
Disclaimer
The information and publications are not meant to be, and do not constitute, financial, investment, trading, or other types of advice or recommendations supplied or endorsed by TradingView. Read more in the Terms of Use.
Related publications
Disclaimer
The information and publications are not meant to be, and do not constitute, financial, investment, trading, or other types of advice or recommendations supplied or endorsed by TradingView. Read more in the Terms of Use.