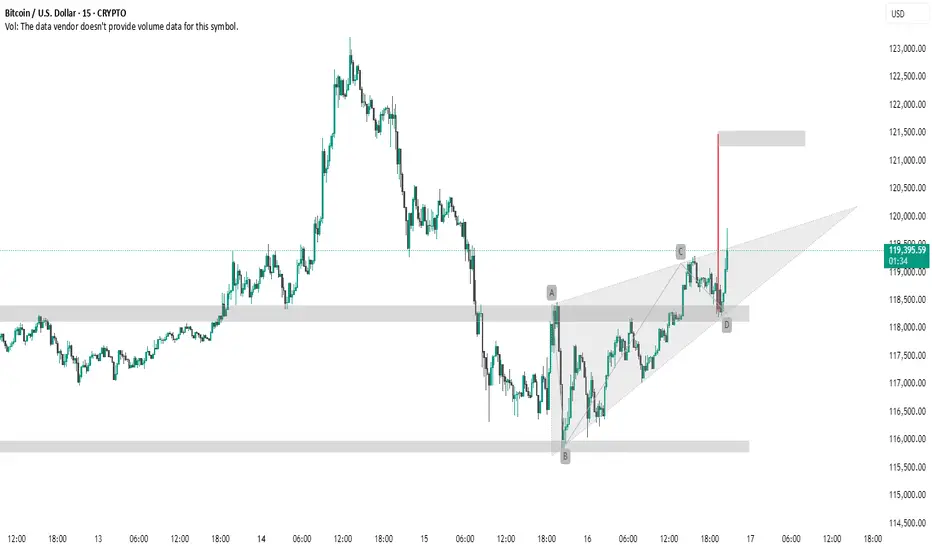
This 15-minute BTC/USD chart presents a **bullish breakout** from a **rising wedge pattern**, which typically has bearish connotations but in this case broke upward — suggesting strong buying pressure.
Key Observations:
* **AB=CD Pattern**: The chart shows a completed harmonic AB=CD pattern, typically a **reversal** or **continuation** signal, depending on context.
* **Breakout & Target Zone**: Price broke above the wedge resistance near point D, with a projected target zone around **\$121,500**, shown with the red vertical line and grey box.
* **Support Zones**: Well-defined support areas near **\$118,000** and **\$116,000** provide a strong base for the bullish move.
Summary:
This setup indicates a **bullish continuation** with a breakout from the wedge, validated by the harmonic pattern and volume momentum (if available). Traders may watch for price holding above \$118,000 to confirm continuation toward \$121,500.
thank u
Related publications
Disclaimer
The information and publications are not meant to be, and do not constitute, financial, investment, trading, or other types of advice or recommendations supplied or endorsed by TradingView. Read more in the Terms of Use.
Related publications
Disclaimer
The information and publications are not meant to be, and do not constitute, financial, investment, trading, or other types of advice or recommendations supplied or endorsed by TradingView. Read more in the Terms of Use.