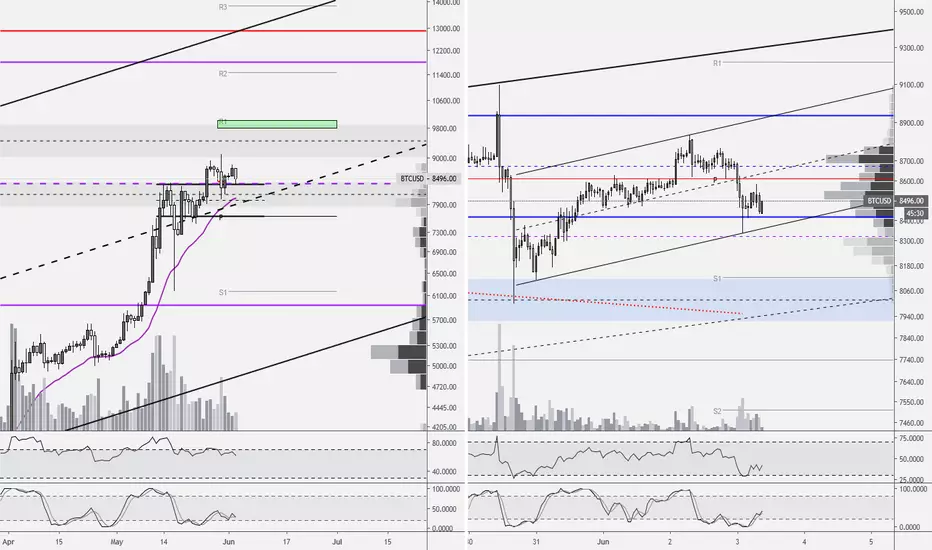
Good morning traders. Over the weekend, price hit my immediate target of $8700 and then a bit more, topping out at $8833. After the short correction overnight, which saw price retest the blue TR support, it looks like price is headed higher once more. At this time, I am looking for price to target the 1H R1 pivot at $9220 as it prints the JAC and then an SOS. We should then generally expect price to retrace toward the TR to print the BUEC/LPS, but I wouldn't expect it to drop below the pivot/red line. The ensuing leg up should take price to the daily R1 pivot at $10,000. However, I expect price to ultimately hit $10,500/$10,600 at least (potentially up to ~$12,900 which is the weekly R1 pivot), if it does make it to $10,000. We have to see what price action and volume look like as it gets to that point.
Looking at the bigger picture, this morning's swing low bounced just above the dashed purple line which is the EQ of the large 2018 TR. Price has also, so far, remained in the top half of the large ascending channel. More recently, this morning's swing low printed the bottom of what appears to be a local ascending channel. Getting above the pivot puts price above that short ascending channel's EQ, as well as the blue TR's EQ and the red S/R flip. The 1H RSI and Stoch RSI resets lend support to this possible upward trajectory toward the 1H R1 pivot. A breakdown below the $7900 demand zone should indicate that price will, instead, continue correcting toward the $6000 level.
The daily chart reminds us that price is ranging between demand and supply zones. The May 30th dip bounced off the demand zone's EQ and the current daily candle is possibly printing a higher low by bouncing off the top of the demand zone/black TR resistance/2018 TR EQ. The 3D chart shows price consolidating ON TOP of the 2018 TR EQ over the past 9 days which would seem to be more bullish than bearish and could lead to a significant pop. The weekly candle is a bit more indecisive, printing what appears to be a northern doji with price closing the week a mere $1 above where it opened. While often touted as a bearish reversal pattern by amateur traders, the reality is that the breakout direction is random at best (about 50/50), so traders should consider it a pause. The fact that it occurred on top of a demand zone seems to suggest upward price continuation. Of course there are no guarantees and all we can do is look at the data and attempt to extract a higher probability course of action. Overall weekly demand volume has also continued to rise during this, what I believe is, wave 3.
Every day, we have a choice to act positively or negatively, so if you get a chance, do something decent for someone today which could be as simple as sharing a nice word with them. You just might change their day, or even their life.
You can always click on the "share" button in the lower right hand of the screen, under the chart, and then click on "Make it mine" from the popup menu in order to get a live version of the chart that you can explore on your own.
Related publications
Disclaimer
The information and publications are not meant to be, and do not constitute, financial, investment, trading, or other types of advice or recommendations supplied or endorsed by TradingView. Read more in the Terms of Use.
Related publications
Disclaimer
The information and publications are not meant to be, and do not constitute, financial, investment, trading, or other types of advice or recommendations supplied or endorsed by TradingView. Read more in the Terms of Use.