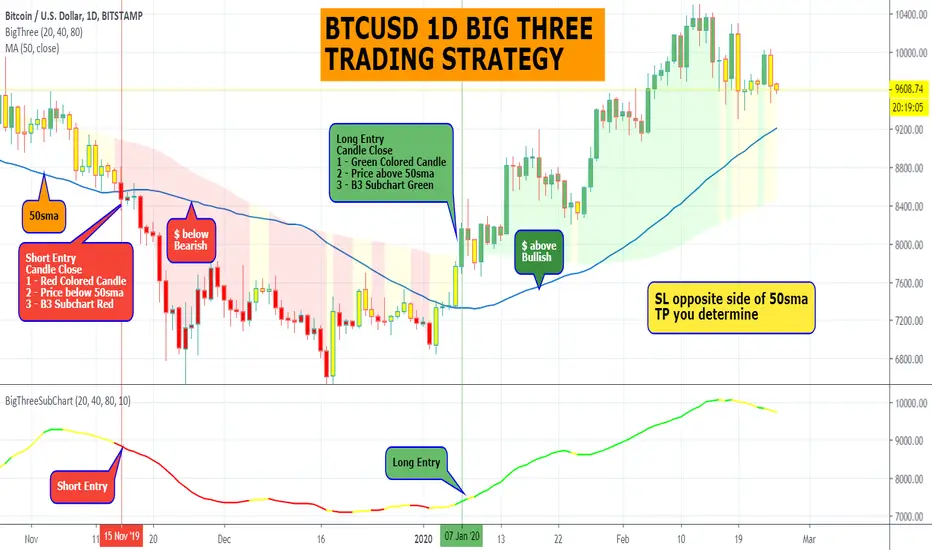
50sma determine trading bias.
Price below 50sma bearish bias.
Price above 50sma bullish bias.
Short Entry
Candle Close
1 - Red Colored Candle
2 - Price below 50sma
3 - B3 Subchart Red
Long Entry
Candle Close
1 - Green Colored Candle
2 - Price above 50sma
3 - B3 Subchart Green
Stop Loss on the opposite side of 50 sma
Take Profit you determine
Disclaimer
The information and publications are not meant to be, and do not constitute, financial, investment, trading, or other types of advice or recommendations supplied or endorsed by TradingView. Read more in the Terms of Use.
Disclaimer
The information and publications are not meant to be, and do not constitute, financial, investment, trading, or other types of advice or recommendations supplied or endorsed by TradingView. Read more in the Terms of Use.