Hey everyone,
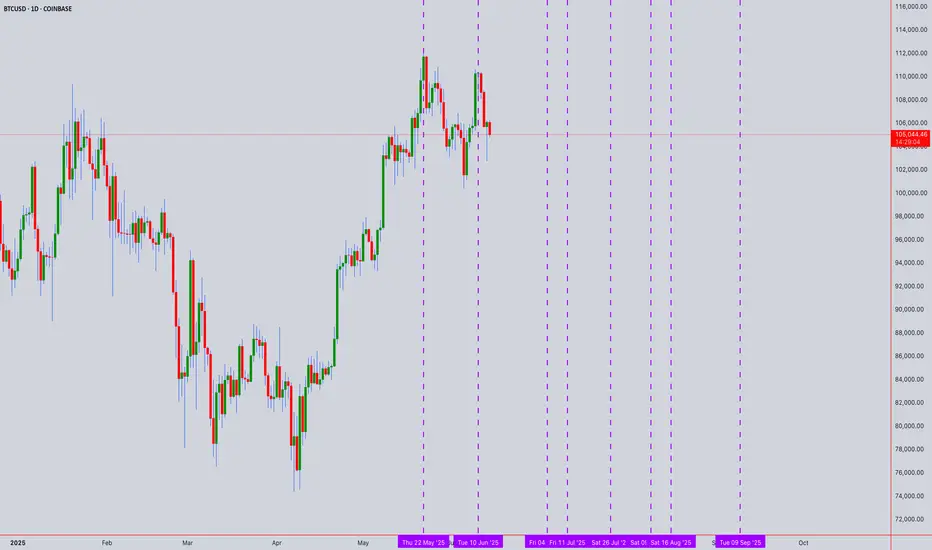
Taking a closer look at the BTCUSD chart, I've plotted some interesting price levels that could act as significant support and resistance in the coming weeks. This analysis aligns with what appears to be a trend-based Fibonacci time analysis, and I've also marked some crucial dates where we might see major market changes.
Based on our observations, we're seeing a range of important price action. For instance, notice the cluster of highs around the 112,048 to 113,343 area. These levels, particularly those marked with an asterisk such as 112,167, 112,503, and 113,006, have previously shown strong upward movements, suggesting they could serve as notable resistance if price attempts to push higher.
Conversely, on the downside, the levels from 111,952 down to 110,665, with points like 111,833, 111,499, and 110,832 highlighted, have historically seen bounces or significant slowing of downward momentum. These could very well act as crucial support areas, preventing further declines.
As we move forward, it will be crucial to observe how price interacts with these levels, especially around the following dates where we might see major market shifts:
July 4th, 2025
July 11th, 2025
July 26th, 2025
August 9th, 2025
August 16th, 2025
September 9th, 2025
The higher resistance points reaching up to 118,793 and lower support extending to 105,407 define a broader range we'll be watching closely.
Keep an eye on these zones for potential reversals or breakthroughs, particularly around the dates mentioned, which could signal the next significant move for Bitcoin. As always, manage your risk accordingly.
What are your thoughts on these levels and potential turning points? Share in the comments below!
Want to Level Up?
Join Shunya Trade’s Mentoring Program to master these strategies and sharpen your technical analysis skills.
Your Feedback Matters!
Let me know how this analysis works for you—your insights will shape future reports!
Let’s navigate the markets together—wisely and proactively.
Trade safely!
⚠️ Disclaimer: This post is educational content and does not constitute investment advice, financial advice, or trading recommendations. The views expressed here are based on technical analysis and are shared solely for informational purposes. The stock market is subject to risks, including capital loss, and readers should exercise due diligence before investing. We do not take responsibility for decisions made based on this content. Consult a certified financial advisor for personalized guidance.
Price High Price Low
112048 111952
112084 111916
*112167 *111833
*112335 *111666
*112503 *111499
*112670 *111332
*112838 *111165
*113006 *110998
*113174 *110832
*113343 *110665
114017 110001
*114693 *109339
115372 108678
116052 108020
116734 107364
*117419 *106709
118105 106057
118793 105407
Disclaimer
The information and publications are not meant to be, and do not constitute, financial, investment, trading, or other types of advice or recommendations supplied or endorsed by TradingView. Read more in the Terms of Use.
Disclaimer
The information and publications are not meant to be, and do not constitute, financial, investment, trading, or other types of advice or recommendations supplied or endorsed by TradingView. Read more in the Terms of Use.