It is sickening. Glassnode is continuing to indicate wallets that bought Bitcoin last year are the ones selling. Yet I know there’s a high probability price action is about to move back up to $48k. Regardless of ‘how’ I feel about this, the market needed to move those players off the board.
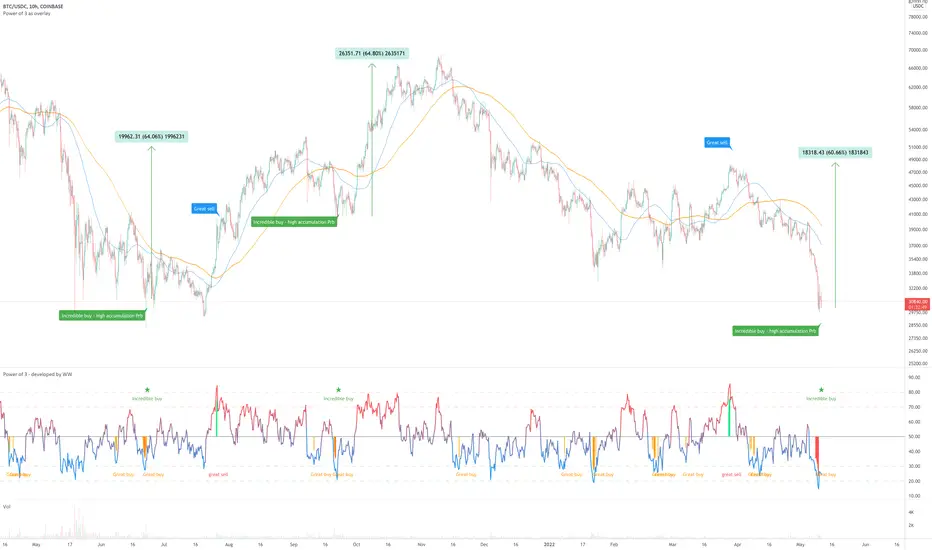
On the above 10hr chart price action has corrected a massive 40% since the sell signal.
>> Side note: As far as I can tell price action has never corrected this deeply in such as short space of time, not even during the March 2020 crash. That’s saying something.
Now is an excellent time to be long. Why? Seriously? Ok here’s why:
1) A buy signal.
2) The green trend line on the 2-day chart. Very little coverage of this out there. Look left. If support to target of this idea is confirmed, well…. we’re going to see a blow off top rally like in 2013 and 2017. This is an important trend line.
Is it possible price action falls further? For sure. For last year’s wallet holders no price is low enough.
Is it probable? No.
Good luck!
Ww
Type: Trade
Risk: <=6% of portfolio
Timeframe: 1-3 months
Return: 60% minimum
2-day chart - that green line

Looking left and zooming out:

On the above 10hr chart price action has corrected a massive 40% since the sell signal.
>> Side note: As far as I can tell price action has never corrected this deeply in such as short space of time, not even during the March 2020 crash. That’s saying something.
Now is an excellent time to be long. Why? Seriously? Ok here’s why:
1) A buy signal.
2) The green trend line on the 2-day chart. Very little coverage of this out there. Look left. If support to target of this idea is confirmed, well…. we’re going to see a blow off top rally like in 2013 and 2017. This is an important trend line.
Is it possible price action falls further? For sure. For last year’s wallet holders no price is low enough.
Is it probable? No.
Good luck!
Ww
Type: Trade
Risk: <=6% of portfolio
Timeframe: 1-3 months
Return: 60% minimum
2-day chart - that green line
Looking left and zooming out:
Note
‘Is this trend cancelled?’ a number of messages like this.No. The buy signal remains.
So why is the market selling off so hard? Two reasons:
1) The Luna foundation is selling thousands of bitcoin on to the market in order to restore its dollar peg. It will not succeed. Why? No one will trust a cent in this stable coin after this. Trust has to exist. Without it, it will collapse to zero just like the other ALGO stable coins before it.
2) The timing is unfortunate. The selling came when Bitcoin was on critical support around $29.4k. A lot of longs got liquidated on the assumption a strong bounce would happen from there. The selling pressure increased as margin calls came about.
What happens next? Switch off the computer for a week, that’s what. There’s nothing the can be done until the Luna foundation drys up their BTC collateral in an attempt to restore a failed peg.
Ww
source: news.coincu.com/87513-luna-selling-all-its-bitcoin-save-ust-peg/
Was there any indication Luna was about to drop like this? Yes, see chart below. However there was no indication they’d be margin called like this.
Can this happen again? Yes.
I mentioned margin calls on large Bitcoin holders before. Micheal Saylor is prime target for this. If Bitcoin crashes to $21k, he will be forced to sell to repay the debt.
Luna chart
Note
** Capitulation ** - what to do? Absolutely nothing. Just wait it out.Couple of observations starting with the big view, 3-month candles (below). These will inform you where to expect significant support.
Below the orange levels mark out support at $29k. Yes it is broken now, that's fine. It can wick down there as much as it likes until the month of July.
The other level is just under $14k. Notice how $20k doesn't even get a look in? Same on the 2 and 1 month candle. Interestingly this price is a full 80% correction from the all time high.
Next the weekly chart. Currently printing the 7th red candle! I don’t know if this week closes as red, if it does it will be the first 7th consecutive red weekly candle in Bitcoin’s history. That’s a bullish marker right there.
The 3-day chart and the 3-day death cross. It is almost here.
The 3-day chart and that 3-day death cross. It is almost there.
A conditional ‘incredible buy’ signal is printing. It has not yet confirmed. This signal has only printed twice before in January 2015 and December 2018.
Lastly the daily chart. The conditional ‘incredibly buy’ signal is already printing, just not confirmed.
On the same daily chart price action is way outside the Bollinger Band. Here’s a pro tip, when you see price action this far outside the band, you know it’s a safe buy (or sell). Why? Statistics my friend. 95% of all candle trade within the band.
In summary.. be patient, let the capitulation play out. By the end of the month it will be one for the history books.
PS: Stay away from ALGO stable coins!
Ww
3-month candles
Weekly chart
3-day chart
Daily chart
Daily chart zoomed in
Note
"incredible buy' prints on the 18hr. The further up the time frames those signals print the stronger they become.Looking left on this time frame these signal result in a test of the 50-day MA (blue line), which is currently around $37k. Probably closer to $35-36k when they meet.
Note
Quick update - read the 2-day chart!Note
For those short term traders amongst you, price action looks likely to make a jump to $35k, back down to $32k, then continuation of uptrend.Note
A 'incredible buy' signal has just printed on the daily chart. November 2019 was the last time that happened.What does that even mean WW? It means there's a 95% probability of upside price action in the weeks ahead.
Note
Very very close to the bottom. Amazing to see sellers continue to step in at those levels. At the moment on the daily chart price action is very close to the 200-week EMA. Do we see one more capitulation? Don't know.By comparison, here is the March 2020 capitulation - was all over in a 5 or 6 days, except that was a 'great buy', therefore the probability of return was not as strong then as it is today.
Trade active
See the bullish divergence?Note
On the 12hr chart there is a falling wedge printing. Look for a breakout. The flagpole extension projects a move from $28k to $38k as quick as that.Note
On the daily chart the falling wedge pattern is waiting to breakout. A number of alt-tokens are printing those formations with upside breakouts.I doubt very few are expecting this 30-40% upside move.
Note
See the little green areas circled in purple on the 2-day chart below? Looking left.. price action has for 90% of the time not seen an upward move less than 30%. That means a high probability of over $35k soon.You may recall the alert I gave on the 'incredible buy' signal on the 3-day chart? It is has now printed on the 1-day chart. The closer in these signals get the more exciting this becomes.
On the daily chart above the falling wedge remains valid with the 70% into the formation by the end of the month.
Note
I think this is worth sharing.. the order book on Binance for the past 15 days has seen the purchase of hundreds of millions of dollars worth of BTC. This is happening across all major exchanges.I've yet to see a large limit sell order. It is always small wallets capitulating.
It is the oldest trick in the book, convince the crowd the asset is going to zero whilst filling your pockets on their fear.
The same will happen in reverse as the crowd becomes greedy.
Note
Right now - wealth transfer continues... Trade active
RSI resistance breakout has printed on the daily chart with an obvious bullish divergence between price action and the oscillators. Hang in there folks...Note
Price action breaks out of falling wedge with convincing volume. The flagpole extension projects a $40k target.Note
Over $400m in BTC purchased this afternoon in a hand-full of limit orders during today's pull back. Retail giving into their emotions, deeper pockets yumming it up for cheap.Note
Truly fascinating watching the volume over those past several weeks. This is the picture today, $140m so far purchased, $70m in the books just waiting to be filled. Time and time again sold into by small orders.This keeps happening until sentiment changes or indeed sellers have no more to sell.
Note
Two plays at the moment, the bear flag on the daily. A continuation of the trend should take price action down to the $19.6k area IF a breakout is confirmed. This is way below the 200-week moving average everyone is talking about. Mr Saylor has to liquidate a $300m position at $22k that he bought around $47k, this action would see a lot more BTC being dumped onto the market at any price thereby placing further negative pressure on price action.On the other side of the coin there’s a resistance channel where price action has previously broken out of since the ‘buy signal’ and now we’re seeing a backtest of past resistance, perfectly normal.
Either way, the direction will be clear by June 17-20th.
Note
Except a lot of support at $28k. I know this is a silly 30 minute chart, however this level is also the daily bullish divergence support line, which just so happens to be printing a bug signal at the $28k level.Note
buy not bug signal, these days both fit.BTC
bc1q2eckdzh0q8vsd7swcc8et6ze7s99khhxyl7zwy
Weblink: patreon.com/withoutworries
Allow 3-6 months on ideas. Not investment advice. DYOR
bc1q2eckdzh0q8vsd7swcc8et6ze7s99khhxyl7zwy
Weblink: patreon.com/withoutworries
Allow 3-6 months on ideas. Not investment advice. DYOR
Related publications
Disclaimer
The information and publications are not meant to be, and do not constitute, financial, investment, trading, or other types of advice or recommendations supplied or endorsed by TradingView. Read more in the Terms of Use.
BTC
bc1q2eckdzh0q8vsd7swcc8et6ze7s99khhxyl7zwy
Weblink: patreon.com/withoutworries
Allow 3-6 months on ideas. Not investment advice. DYOR
bc1q2eckdzh0q8vsd7swcc8et6ze7s99khhxyl7zwy
Weblink: patreon.com/withoutworries
Allow 3-6 months on ideas. Not investment advice. DYOR
Related publications
Disclaimer
The information and publications are not meant to be, and do not constitute, financial, investment, trading, or other types of advice or recommendations supplied or endorsed by TradingView. Read more in the Terms of Use.