Greetings, here is an update on the Elliott Wave Count for Bitcoin.
I highly recommend looking at our last Analysis beforehand to get a better understanding of the case and the developments. As last time we also added some Callouts to try to make it more understandable as it is quiet a tricky situation with different possibilities.
Since our last analysis we got another high which doesn't change much regarding our scenarios.
We still assume that we are in a move upwards displayed as the green 5 Wave move.
Let's look into the more bullish case first.
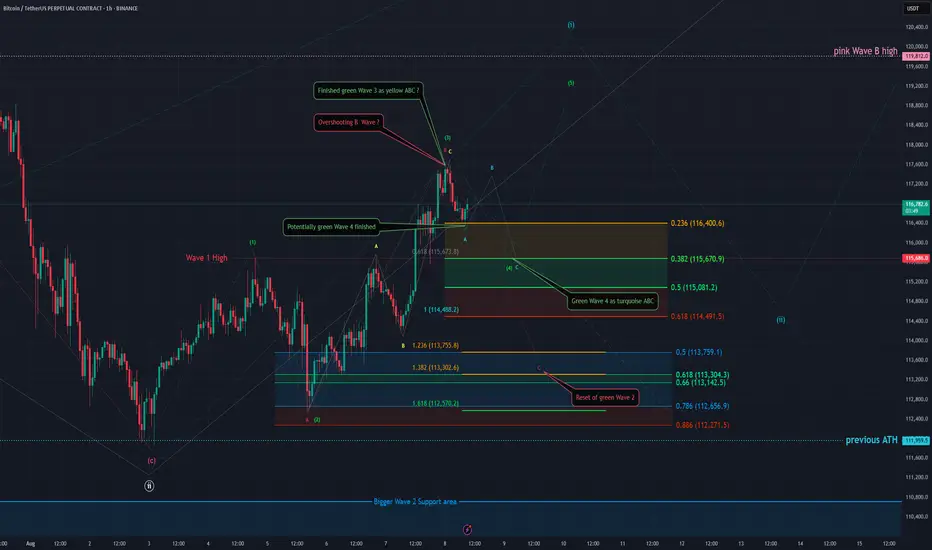
In the first scenario we assume that we finished the green Wave 1, 2 and that we also finished green Wave 3 now. The 3rd Wave is a ABC displayed as yellow and we're looking for the green Wave 4 retracement before another move up in green Wave 5:
The support area for this green Wave 4 lies between the 0.236 FIB at 116'400 USD and the 0.5 FIB at 115'081 USD. Technically we could have finished the green Wave 4 with the recent low at around 116'400 USD which touched the 0.236 FIB of our support area but it looks rather short and we would prefer a bigger correction in the the turquoise ABC. This turquoise ABC would preferably take to or below 115'670 USD which is the 0.382 FIB of our support area and at the same time the green Wave 1 high. Due assuming this being a diagonal this case would be better as it is common to get overlap between Wave 1 and 4 in diagonals but it is not a must or given.
The alternative scenario is that the recent high was not the green Wave 3 but an overshooting B wave of the pink ABC which would be followed by a C wave down which would then reset green Wave 2. As already mentioned in our last analysis this would be an expanding flat as correction for the green Wave 2. Targets for the pink Wave C would be the 0.618 FIB at 115'673 USD the 1 to 1 FIB at 114'488 USD, the 1.236 FIB at 113'755 USD, the 1.382 FIB at 113'302 USD and the 1.618 FIB at 112'570 USD. Most commonly for such a C Wave is the 0.618 and the 1.618 FIB.
We got a lot confluence around the 115'670 USD price level as besides being the 0.382 FIB of our Wave 4 support area and the 0.618 retracement for our pink Wave C it is additionally the green Wave 1 high as well as the yellow A wave high.
We hope you enjoyed our analysis! :)
Thanks for reading.
Would appreciate a boost and follow if you're interested in more analysis in this style! ^^
NO FINANCIAL ADVICE.
I highly recommend looking at our last Analysis beforehand to get a better understanding of the case and the developments. As last time we also added some Callouts to try to make it more understandable as it is quiet a tricky situation with different possibilities.
Since our last analysis we got another high which doesn't change much regarding our scenarios.
We still assume that we are in a move upwards displayed as the green 5 Wave move.
Let's look into the more bullish case first.
In the first scenario we assume that we finished the green Wave 1, 2 and that we also finished green Wave 3 now. The 3rd Wave is a ABC displayed as yellow and we're looking for the green Wave 4 retracement before another move up in green Wave 5:
The support area for this green Wave 4 lies between the 0.236 FIB at 116'400 USD and the 0.5 FIB at 115'081 USD. Technically we could have finished the green Wave 4 with the recent low at around 116'400 USD which touched the 0.236 FIB of our support area but it looks rather short and we would prefer a bigger correction in the the turquoise ABC. This turquoise ABC would preferably take to or below 115'670 USD which is the 0.382 FIB of our support area and at the same time the green Wave 1 high. Due assuming this being a diagonal this case would be better as it is common to get overlap between Wave 1 and 4 in diagonals but it is not a must or given.
The alternative scenario is that the recent high was not the green Wave 3 but an overshooting B wave of the pink ABC which would be followed by a C wave down which would then reset green Wave 2. As already mentioned in our last analysis this would be an expanding flat as correction for the green Wave 2. Targets for the pink Wave C would be the 0.618 FIB at 115'673 USD the 1 to 1 FIB at 114'488 USD, the 1.236 FIB at 113'755 USD, the 1.382 FIB at 113'302 USD and the 1.618 FIB at 112'570 USD. Most commonly for such a C Wave is the 0.618 and the 1.618 FIB.
We got a lot confluence around the 115'670 USD price level as besides being the 0.382 FIB of our Wave 4 support area and the 0.618 retracement for our pink Wave C it is additionally the green Wave 1 high as well as the yellow A wave high.
We hope you enjoyed our analysis! :)
Thanks for reading.
Would appreciate a boost and follow if you're interested in more analysis in this style! ^^
NO FINANCIAL ADVICE.
Note
The last Analysis for all the extra curious minds amongst you: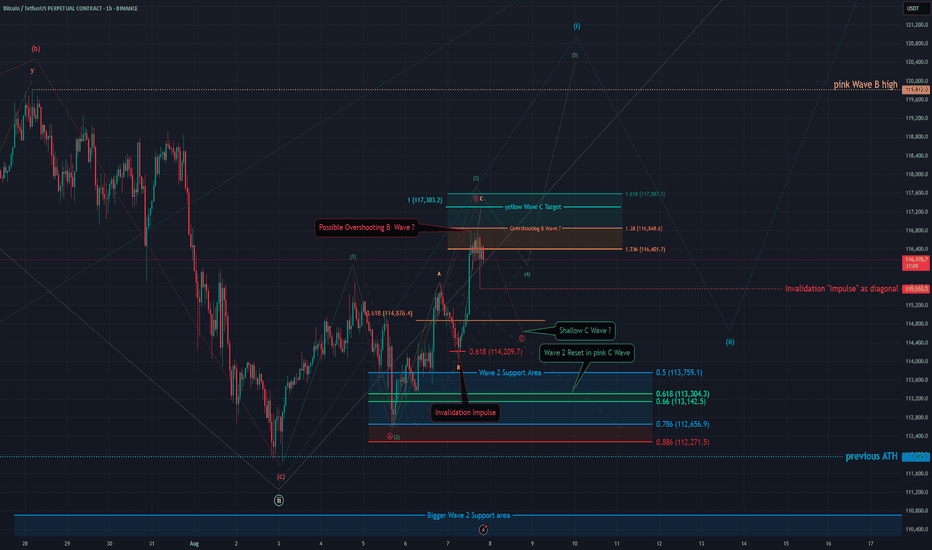
Disclaimer
The information and publications are not meant to be, and do not constitute, financial, investment, trading, or other types of advice or recommendations supplied or endorsed by TradingView. Read more in the Terms of Use.
Disclaimer
The information and publications are not meant to be, and do not constitute, financial, investment, trading, or other types of advice or recommendations supplied or endorsed by TradingView. Read more in the Terms of Use.