Summary
Bitcoin is showing a classic multi-timeframe confluence setup. On the weekly chart, BTC is holding above key EMAs with bullish continuation patterns. The daily chart shows a breakout from a descending triangle, while 4H and 30-min charts confirm a narrowing price wedge inside a larger compression zone. Momentum is rising, but volume remains subdued. A confirmed breakout above $108K may trigger a measured move toward $114K–$118K, while a breakdown below $105K could lead to deeper retracements.
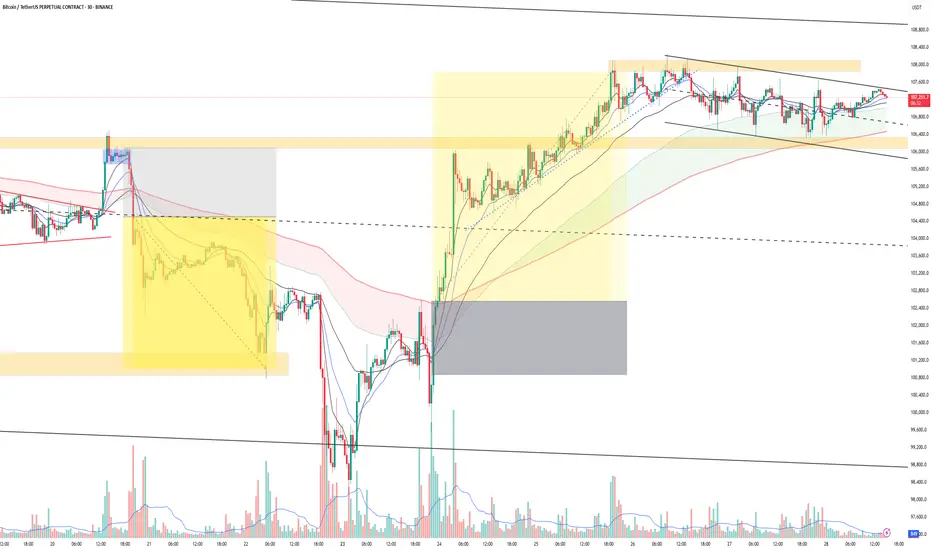
BTC 30m chart forming a tight triangle with bull flag structure inside.
Price hugging EMAs, RSI ~52, Kalman flipped green, ADX ~23 = prepping for move. Breakout above $107.6K can push fast to $108.3K+. Breakdown below $106.6K weakens structure.
Scaling out
4H: Descending wedge with bullish RSI divergence, ADX rising, support at $104.5K.
1D: Breakout from falling wedge, reclaiming EMAs, but needs volume.
1W: Bullish flag breakout setup; EMAs aligned; RSI > 57, room to run toward $114K if $108K clears.
Watch volume confirmation across timeframes for trend validation.
Bitcoin is showing a classic multi-timeframe confluence setup. On the weekly chart, BTC is holding above key EMAs with bullish continuation patterns. The daily chart shows a breakout from a descending triangle, while 4H and 30-min charts confirm a narrowing price wedge inside a larger compression zone. Momentum is rising, but volume remains subdued. A confirmed breakout above $108K may trigger a measured move toward $114K–$118K, while a breakdown below $105K could lead to deeper retracements.
BTC 30m chart forming a tight triangle with bull flag structure inside.
Price hugging EMAs, RSI ~52, Kalman flipped green, ADX ~23 = prepping for move. Breakout above $107.6K can push fast to $108.3K+. Breakdown below $106.6K weakens structure.
Scaling out
4H: Descending wedge with bullish RSI divergence, ADX rising, support at $104.5K.
1D: Breakout from falling wedge, reclaiming EMAs, but needs volume.
1W: Bullish flag breakout setup; EMAs aligned; RSI > 57, room to run toward $114K if $108K clears.
Watch volume confirmation across timeframes for trend validation.
A Haque
Founder | MyTradingJournal
📊 Financial Market Analyst | Trader | Educator
🐦 Twitter: @MyTradingJnl6th
📺 YouTube: @MyTradingJournal6th
Founder | MyTradingJournal
📊 Financial Market Analyst | Trader | Educator
🐦 Twitter: @MyTradingJnl6th
📺 YouTube: @MyTradingJournal6th
Disclaimer
The information and publications are not meant to be, and do not constitute, financial, investment, trading, or other types of advice or recommendations supplied or endorsed by TradingView. Read more in the Terms of Use.