Here is a summary of what I'm looking at:
Analysis:
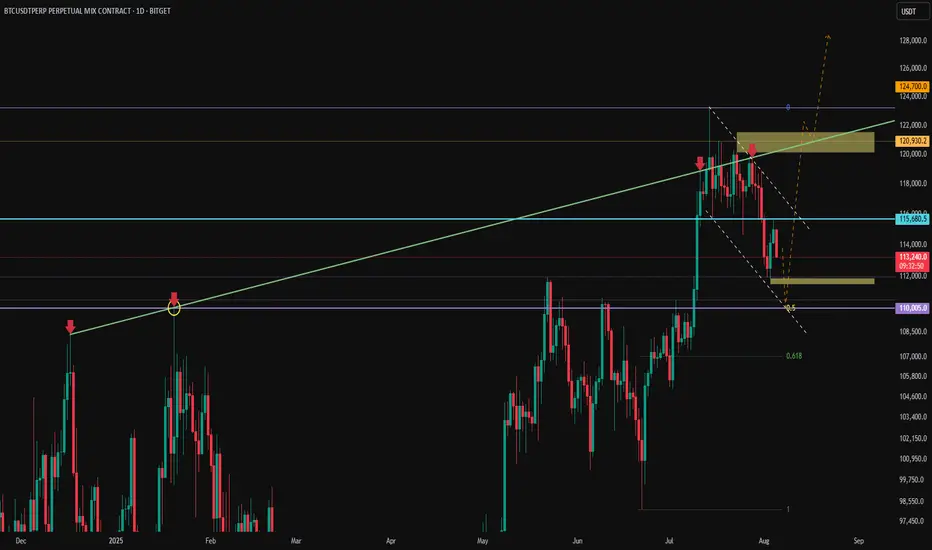
I believe that Bitcoin with visit the 110K - 111.5K zone which also coincide with the bottom of the channel, the Weekly high @ 110K and 0.5 fib (ish) and grab what liquidity is currently sat below.
Once done, move up to the higher liquidity zone, which would break once again above the Green line which would hopefully flip into support, and send BTC parabolic with a peak Nov-Dec.
- Price currently struggling to surpass the Weekly low @ 115,650 (Blue line)
- The green line is acting as resistance, with a brief break-through mid-July.
- Huge liquidity zone 120-121.5K which will be inevitably grabbed (Yellow box)
- Liquidity sitting below @ 111K (Yellow box)
- 0.5 fib currently at @ 110K (which also acted as the Weekly high in Jan 25)
- A descending channel formation
Analysis:
I believe that Bitcoin with visit the 110K - 111.5K zone which also coincide with the bottom of the channel, the Weekly high @ 110K and 0.5 fib (ish) and grab what liquidity is currently sat below.
Once done, move up to the higher liquidity zone, which would break once again above the Green line which would hopefully flip into support, and send BTC parabolic with a peak Nov-Dec.
Disclaimer
The information and publications are not meant to be, and do not constitute, financial, investment, trading, or other types of advice or recommendations supplied or endorsed by TradingView. Read more in the Terms of Use.
Disclaimer
The information and publications are not meant to be, and do not constitute, financial, investment, trading, or other types of advice or recommendations supplied or endorsed by TradingView. Read more in the Terms of Use.