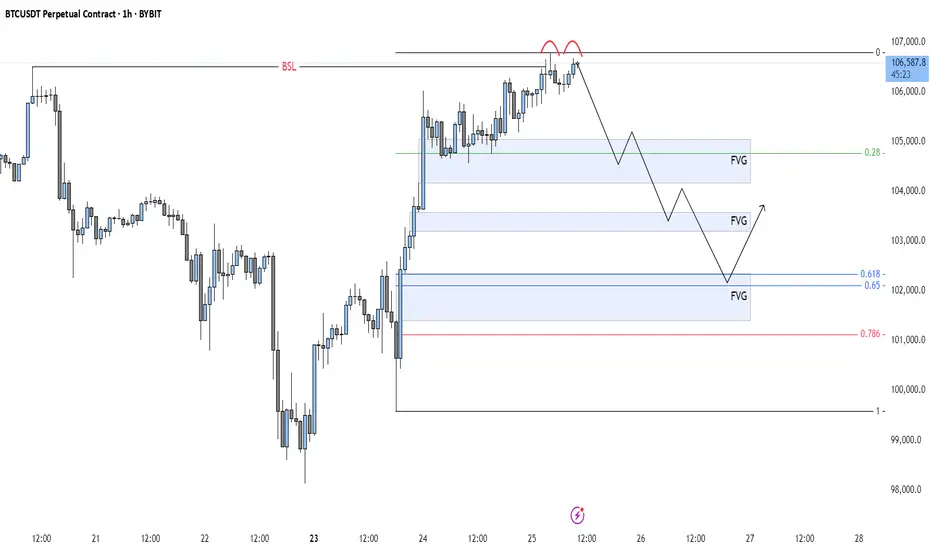
Price has recently executed a Buy Side Liquidity Sweep just above the previous high. This type of move often signals a potential shift in market direction, especially when followed by signs of exhaustion or failure to push higher. In this case, price has formed a double top near the 106,600 level, a classic sign of weakening bullish momentum and hesitation at a key resistance area.
Following the Sweep, the projection suggests a possible rejection from this region, leading to a corrective move to rebalance the inefficiencies left behind by the sharp upward impulse. These inefficiencies are marked as Fair Value Gaps—areas where price moved too quickly, leaving imbalanced zones between buyers and sellers. The market tends to return to these areas over time as it seeks equilibrium.
The first Gap lies just below the 0.28 Fibonacci retracement and may serve as an initial area for a reaction. If price slices through this level without meaningful support, attention shifts to the second Gap, which aligns closely with the 0.50 to 0.618 retracement zone. This region is historically significant for pullbacks and could offer a temporary pause or bounce.
Should the move extend further, the third and deepest Gap, located between the 0.618 and 0.65 levels, becomes a key area of interest. It marks a critical rebalancing zone that could attract stronger buying interest. If this area fails to hold, the 0.786 retracement level sits just below and may act as a final point for support before any broader directional change.
For refined entries, traders can watch lower timeframes like the 5-minute chart. Look for signs of weakness, such as an inverted Gap or a lower-timeframe break in structure, to time positions with tighter risk. This allows participation in the broader move while maintaining tactical precision.
The confluence of a Buy Side Liquidity Sweep, a double top, and multiple Gaps below provides a clear framework for a potential downside play. As always, let the price action lead.
Patience, confirmation, and context are key to executing with confidence.
Note
Let me know in the comments what you think that BTC will do!MY LINKS
📈 Free Signals
bit.ly/3YxiRXr
💬 Discord Community
bit.ly/4jHHA3O
💵 Favorite Exchange
bit.ly/4lBeTXt
📈 Free Signals
bit.ly/3YxiRXr
💬 Discord Community
bit.ly/4jHHA3O
💵 Favorite Exchange
bit.ly/4lBeTXt
Disclaimer
The information and publications are not meant to be, and do not constitute, financial, investment, trading, or other types of advice or recommendations supplied or endorsed by TradingView. Read more in the Terms of Use.
MY LINKS
📈 Free Signals
bit.ly/3YxiRXr
💬 Discord Community
bit.ly/4jHHA3O
💵 Favorite Exchange
bit.ly/4lBeTXt
📈 Free Signals
bit.ly/3YxiRXr
💬 Discord Community
bit.ly/4jHHA3O
💵 Favorite Exchange
bit.ly/4lBeTXt
Disclaimer
The information and publications are not meant to be, and do not constitute, financial, investment, trading, or other types of advice or recommendations supplied or endorsed by TradingView. Read more in the Terms of Use.