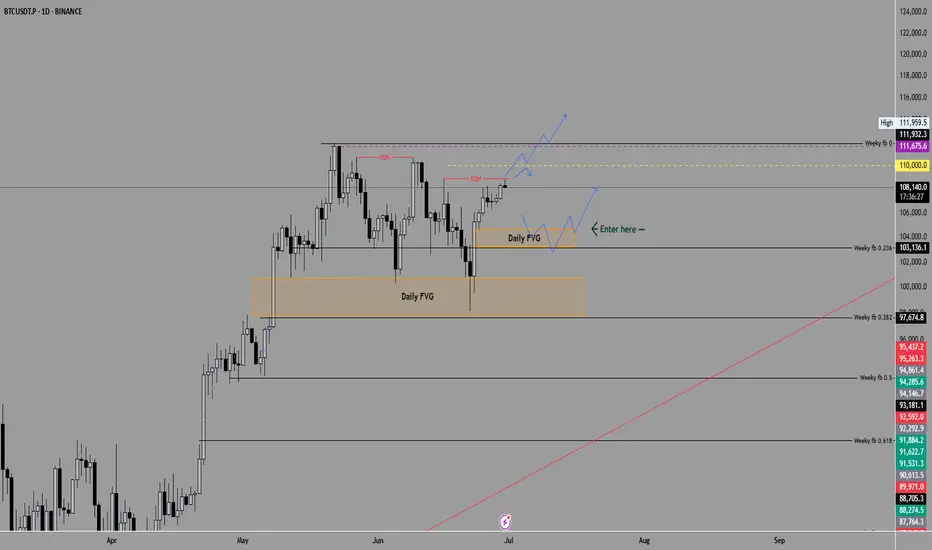
Chart key points
Price: Currently around $108,129
Key levels:
There are EQH (equal highs) around $111,500–$112,000 acting as liquidity.
There’s a smaller Daily FVG (Fair Value Gap) between ~$105,500–$107,000.
A larger Daily FVG lower around ~$99,000–$103,000.
Weekly Fibs mark retracement levels below.
Two projected paths: One a break above the EQH liquidity; the other shows a deeper pullback before that.
📈 Scenario 1: Bullish continuation + liquidity sweep
Idea:
BTC pushes up to sweep the EQH liquidity near $111,500–$112,000.
Breaks above, hits stops, and either:
Continues higher to the next resistance zone near $115,000–$118,000.
OR fakes out, sweeps liquidity, and retraces to the Daily FVG.
What to watch:
If price closes strongly above EQH with volume, look for continuation buys.
Confirmation: Break/retest of $111,500 as support.
📉 Scenario 2: Deeper pullback before continuation
Idea:
Price fails to break the EQH cleanly.
Pulls back into the small Daily FVG or deeper into the larger Daily FVG.
Reaccumulates around the $99,000–$104,000 zone.
From there, look for a bullish reaction for a safer long.
What to watch:
Weakness at EQH: Wicks or rejection candles.
Entry triggers: Strong bullish PA in the Daily FVG zones + confirmation.
✅ Key takeaways
Liquidity above EQH means there’s incentive for smart money to run stops.
FVGs are your high-probability reaction zones.
wait for price to trade into imbalance with signs of bullish order flow.
Disclaimer
The information and publications are not meant to be, and do not constitute, financial, investment, trading, or other types of advice or recommendations supplied or endorsed by TradingView. Read more in the Terms of Use.
Disclaimer
The information and publications are not meant to be, and do not constitute, financial, investment, trading, or other types of advice or recommendations supplied or endorsed by TradingView. Read more in the Terms of Use.