Greetings and welcome to our next update for our Elliott Wave Count for Bitcoin.
The case is pretty much the same as yesterday in our last update so we'll try to keep it shorter today but feel free to check out our last analysis if you're interested in more details!
It'll be linked below in the notes :)
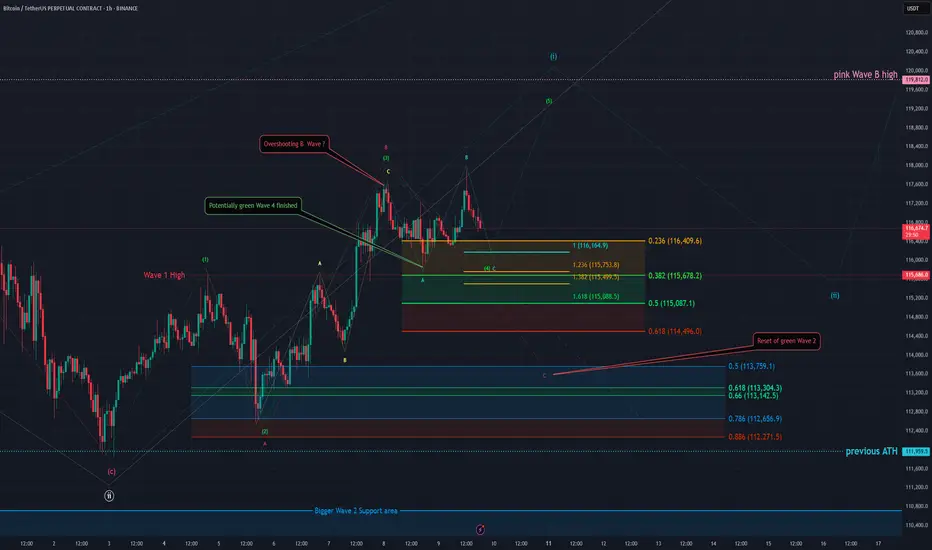
It is possible that we finished the green Wave 4 already and started moving up in the green Wave 5 but we think it is rather unlikely as the move up looks like a three wave move which indicates that it is corrective. It looks more like the correction extends a bit in the turquoise ABC a possibility we already mentioned yesterday.
We got the turquoise A in and the B was an overshooting Wave B and it seems we started working on the C Wave down. The targets for the turquoise Wave C are the 1 to 1 FIB at 116'164 USD, the 1.236 FIB at 115'753 USD, the 1.382 FIB at 115'499 USD which would also be in confluence with the 0.382 FIB of the Wave 4 support area and finally the 1.618 FIB at 115'088 USD which is right on top of the 0.5 FIB of the Wave 4 support area.
Keep in mind it still could be the bigger ABC displayed in red which would reset the green Wave 4 but we think the green count is more likely for now. First indication would be breaking the green Wave 4 support area.
Thanks for reading.
Would really recommend to check out the last analysis too for a better in depth view of the count and scenarios. :)
NO FINANCIAL ADVICE.
The case is pretty much the same as yesterday in our last update so we'll try to keep it shorter today but feel free to check out our last analysis if you're interested in more details!
It'll be linked below in the notes :)
It is possible that we finished the green Wave 4 already and started moving up in the green Wave 5 but we think it is rather unlikely as the move up looks like a three wave move which indicates that it is corrective. It looks more like the correction extends a bit in the turquoise ABC a possibility we already mentioned yesterday.
We got the turquoise A in and the B was an overshooting Wave B and it seems we started working on the C Wave down. The targets for the turquoise Wave C are the 1 to 1 FIB at 116'164 USD, the 1.236 FIB at 115'753 USD, the 1.382 FIB at 115'499 USD which would also be in confluence with the 0.382 FIB of the Wave 4 support area and finally the 1.618 FIB at 115'088 USD which is right on top of the 0.5 FIB of the Wave 4 support area.
Keep in mind it still could be the bigger ABC displayed in red which would reset the green Wave 4 but we think the green count is more likely for now. First indication would be breaking the green Wave 4 support area.
Thanks for reading.
Would really recommend to check out the last analysis too for a better in depth view of the count and scenarios. :)
NO FINANCIAL ADVICE.
Note
The last analysis from yesterday for all the extra interested ones: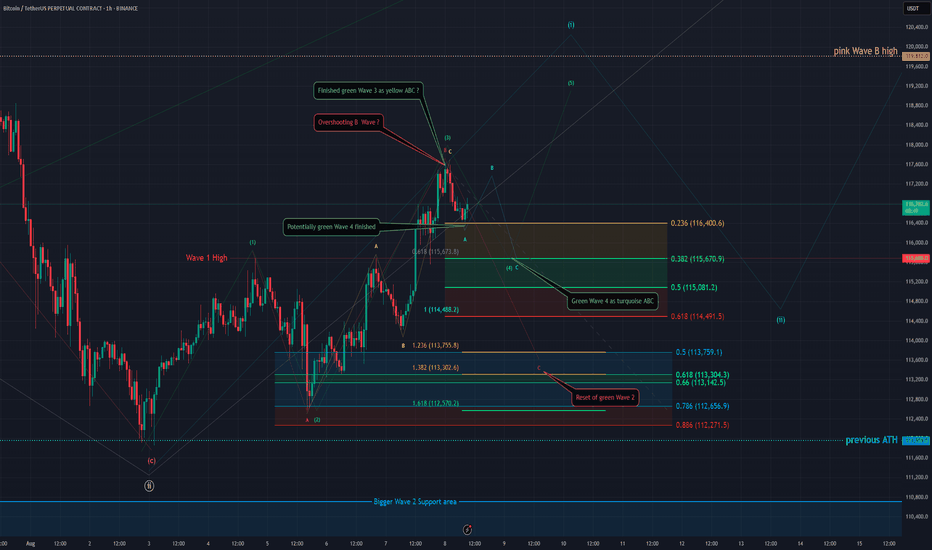
Disclaimer
The information and publications are not meant to be, and do not constitute, financial, investment, trading, or other types of advice or recommendations supplied or endorsed by TradingView. Read more in the Terms of Use.
Disclaimer
The information and publications are not meant to be, and do not constitute, financial, investment, trading, or other types of advice or recommendations supplied or endorsed by TradingView. Read more in the Terms of Use.