📊 Technical Analysis – BTCUSDT.P (1H Chart)
✅ 1. Overall Trend:
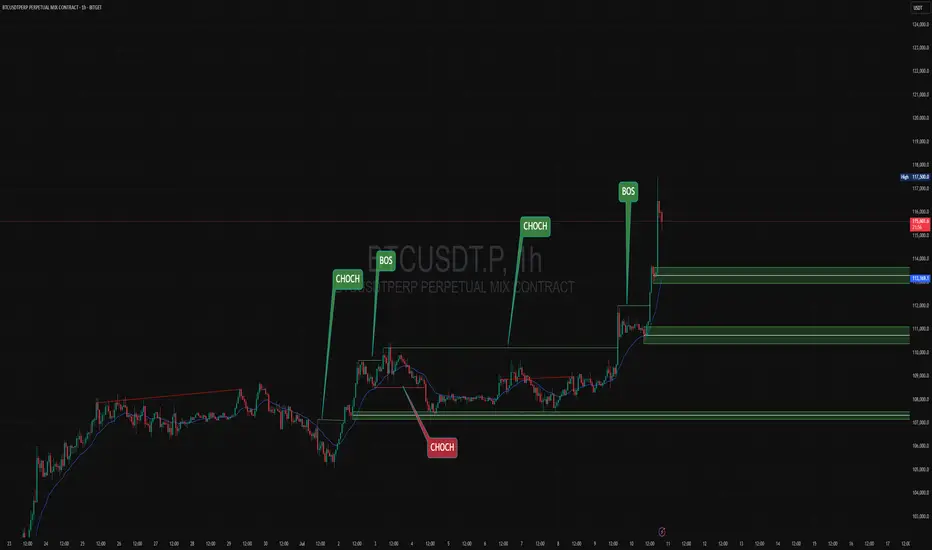
The market is in a strong bullish trend on the 1-hour chart, confirmed by multiple CHoCH (Change of Character) and BOS (Break of Structure) points.
📌 2. Price Structure:
🔹 First CHoCH:
Indicates weakness in the prior downtrend.
The following BOS confirms a structure shift to the upside.
🔹 Second CHoCH:
After a minor correction, buyers regained control.
Another BOS confirms continuation of bullish momentum.
🟢 3. Demand Zones:
Multiple demand zones are marked in green.
The most relevant zone right now is between 113,100 – 113,600, still untested.
A bullish reaction is likely if price pulls back into this area.
⚠️ 4. Current Price Action:
Price has reached around 115,487 after the latest BOS.
A minor bearish reaction is visible, suggesting a possible short-term correction.
As long as the BOS level holds, the overall structure remains bullish.
🔍 5. Candlestick Signal:
No clear Engulfing candle yet, but if:
A strong red candle forms followed by a full bullish engulfing candle within the demand zone,
→ that would be a valid Bullish Engulfing pattern and a potential reversal signal.
🎯 Conclusion:
Market structure is currently bullish.
Watch for pullbacks to the 113,100–113,600 zone.
Ideal entries come with confirmation (e.g., engulfing candle or strong rejection).
Always apply strict risk management.
❗️Disclaimer:
This analysis is for educational purposes only and does not constitute financial advice or a buy/sell signal.
Please do your own research and trade based on your personal strategy and risk tolerance.

 BTCUSDT.P
✅ 1. Overall Trend:
The market is in a strong bullish trend on the 1-hour chart, confirmed by multiple CHoCH (Change of Character) and BOS (Break of Structure) points.
📌 2. Price Structure:
🔹 First CHoCH:
Indicates weakness in the prior downtrend.
The following BOS confirms a structure shift to the upside.
🔹 Second CHoCH:
After a minor correction, buyers regained control.
Another BOS confirms continuation of bullish momentum.
🟢 3. Demand Zones:
Multiple demand zones are marked in green.
The most relevant zone right now is between 113,100 – 113,600, still untested.
A bullish reaction is likely if price pulls back into this area.
⚠️ 4. Current Price Action:
Price has reached around 115,487 after the latest BOS.
A minor bearish reaction is visible, suggesting a possible short-term correction.
As long as the BOS level holds, the overall structure remains bullish.
🔍 5. Candlestick Signal:
No clear Engulfing candle yet, but if:
A strong red candle forms followed by a full bullish engulfing candle within the demand zone,
→ that would be a valid Bullish Engulfing pattern and a potential reversal signal.
🎯 Conclusion:
Market structure is currently bullish.
Watch for pullbacks to the 113,100–113,600 zone.
Ideal entries come with confirmation (e.g., engulfing candle or strong rejection).
Always apply strict risk management.
❗️Disclaimer:
This analysis is for educational purposes only and does not constitute financial advice or a buy/sell signal.
Please do your own research and trade based on your personal strategy and risk tolerance.
Disclaimer
The information and publications are not meant to be, and do not constitute, financial, investment, trading, or other types of advice or recommendations supplied or endorsed by TradingView. Read more in the Terms of Use.
Disclaimer
The information and publications are not meant to be, and do not constitute, financial, investment, trading, or other types of advice or recommendations supplied or endorsed by TradingView. Read more in the Terms of Use.