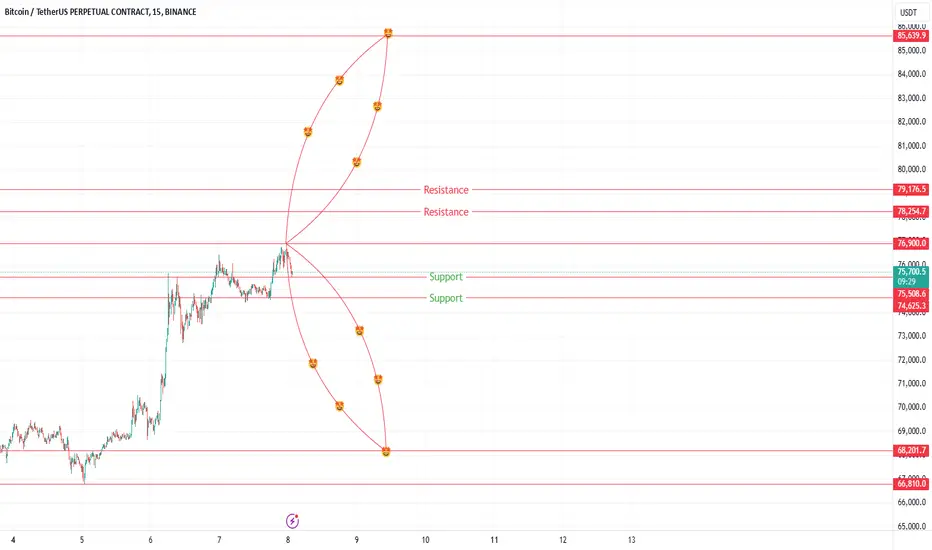
Btc chart done using circles.
The emoticons represent price targets, the red arches act as support and resistance once the price enters the area.
The emoticons represent price targets, the red arches act as support and resistance once the price enters the area.
Disclaimer
The information and publications are not meant to be, and do not constitute, financial, investment, trading, or other types of advice or recommendations supplied or endorsed by TradingView. Read more in the Terms of Use.
Disclaimer
The information and publications are not meant to be, and do not constitute, financial, investment, trading, or other types of advice or recommendations supplied or endorsed by TradingView. Read more in the Terms of Use.