BTCUSDT – 1H Chart Analysis |Critical Retest at Broken trendline
📅 \Date:\ August 5, 2025
⏰ \Timeframe:\ 1H
📍 \Exchange:\ MEXC
💱 \Pair:\ BTC/USDT Perpetual Futures
---
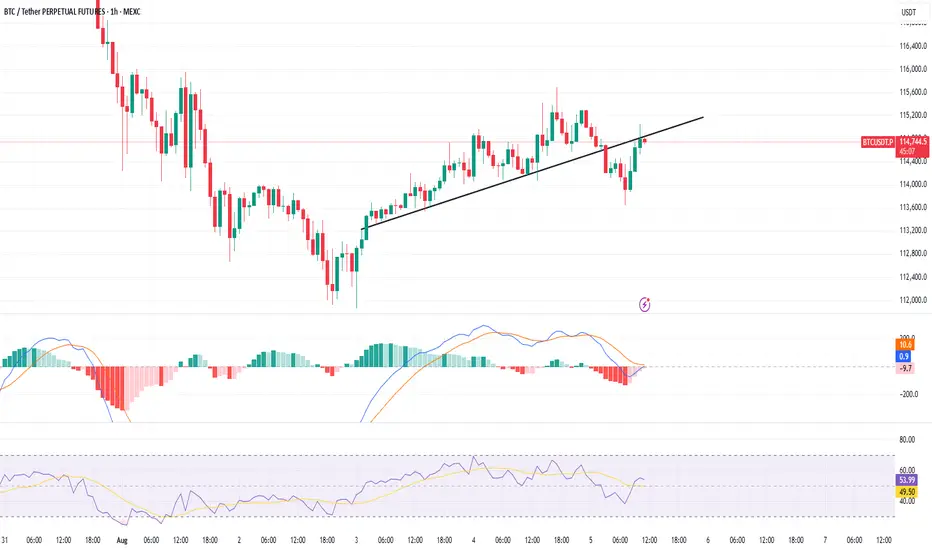
\📉 Trendline Breakdown and Retest\
BTC has broken below the ascending trendline and is now retesting it from the underside. This setup often signals a \bearish retest\, especially when momentum is weak and rejection wicks appear near previous support turned resistance.
Last rejection came around \\$114,800\, right at the underside of the broken trendline.
---
\🔍 Key Technical Levels\
* \Resistance:\ \$114,800–\$115,000 (confluence of trendline + supply zone)
* \Support:\ \$113,300 (horizontal green zone, strong historical demand)
Failure to reclaim the trendline might open the path toward \\$113,300\. A strong breakout above the trendline may flip bias short-term bullish.
---
\📊 Indicators Overview\
\MACD\:
• Bearish momentum is fading
• Bullish crossover is forming but not yet confirmed
• Needs clearer separation and histogram recovery for confirmation
\RSI:\
• Currently at \49.43\, struggling to cross the midline
• Facing resistance near \53.14\
• Neutral to slightly bearish momentum
---
\⚠️ What to Watch\
🔺 \Bullish Scenario:\ Break and close above \$115,000 → continuation toward \$116,200
🔻 \Bearish Scenario:\ Rejection at trendline → decline toward \$113,300
---
\🧭 Conclusion\
BTC is at a decision point. The next few candles will likely confirm whether this is a failed breakdown or a clean rejection. Watch volume and candle closes carefully.
\Patience is key – confirmation is everything.\
---
\#Bitcoin #BTCUSDT #TechnicalAnalysis #Trendline #MACD #RSI #SupportResistance #CryptoTrading\
Trade active
ACTIVATED :)Disclaimer
The information and publications are not meant to be, and do not constitute, financial, investment, trading, or other types of advice or recommendations supplied or endorsed by TradingView. Read more in the Terms of Use.
Disclaimer
The information and publications are not meant to be, and do not constitute, financial, investment, trading, or other types of advice or recommendations supplied or endorsed by TradingView. Read more in the Terms of Use.