#Bitcoin Technical Analysis:-
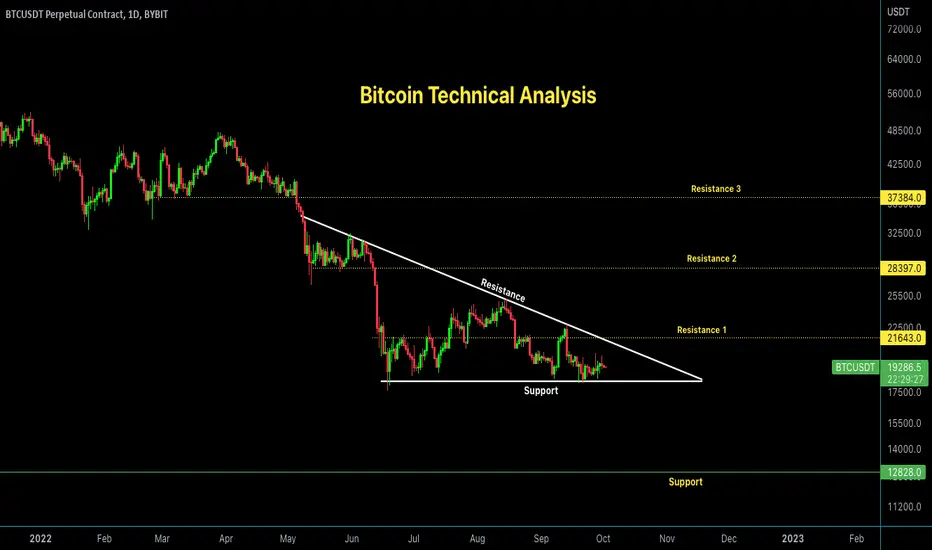
 BTC currently trading at $19300 Level.
As Per chart We can see Descending Triangle is Forming in BTC daily Chart.
As Per chart Ruls it is bearish and Maximum times it Breakout below side.
But Never Follow Blindly always wait for Confirmation imo.
So As Per chart if Break down $18000 Level then we can see $12800 Level.
But If break out Upward side and Cross $21600 Level then we can see $28400
Never forget to Placed stop Loss if open any Scalp Trade.
Support:- $18,000/$13,000
Resistance:- $28400/$37400
Twitter: twitter.com/CryptoPatel
Telegram: t.me/OfficialCryptoPatel
Instagram: instagram.com/cryptopatel?utm_medium=copy_link
Telegram: t.me/OfficialCryptoPatel
Instagram: instagram.com/cryptopatel?utm_medium=copy_link
Related publications
Disclaimer
The information and publications are not meant to be, and do not constitute, financial, investment, trading, or other types of advice or recommendations supplied or endorsed by TradingView. Read more in the Terms of Use.