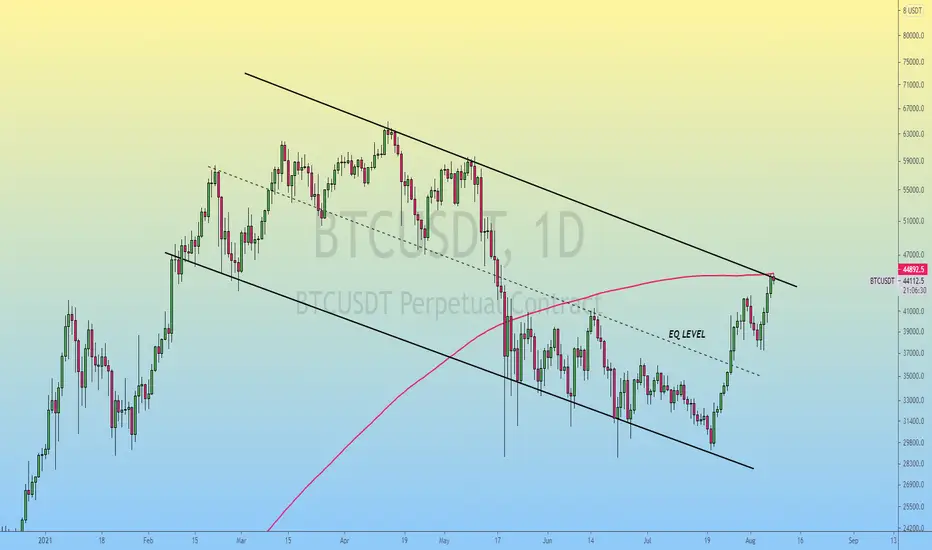
#BTC (Update)
In Daily timeframe Chart, Bitcoin is testing Another Trendline Resistance & 200-Days Moving Average (44.8k)
In 12H timeframe, RSI is Printing Classical Bearish Divergence, Not a Good Sign While It's Facing Key Resistance Area.

$44444 is the "Make it or Break it Level" for Bitcoin.
If Daily Candle Closed Above the MA200 (44.8k), Expecting Descending Chanel Breakout & Bitcoin Might Retest It's Previous ATH (61k).
In Bearish Case, If Bitcoin Bulls Failed to Clear the MA200 Resistance, Bitcoin Might Retest the 38k Range.
Please like the idea for Support & Subscribe for More ideas like this and share your ideas and charts in Comments Section..!!
Thanks for Your Love & Support..!!
In Daily timeframe Chart, Bitcoin is testing Another Trendline Resistance & 200-Days Moving Average (44.8k)
In 12H timeframe, RSI is Printing Classical Bearish Divergence, Not a Good Sign While It's Facing Key Resistance Area.
$44444 is the "Make it or Break it Level" for Bitcoin.
If Daily Candle Closed Above the MA200 (44.8k), Expecting Descending Chanel Breakout & Bitcoin Might Retest It's Previous ATH (61k).
In Bearish Case, If Bitcoin Bulls Failed to Clear the MA200 Resistance, Bitcoin Might Retest the 38k Range.
Please like the idea for Support & Subscribe for More ideas like this and share your ideas and charts in Comments Section..!!
Thanks for Your Love & Support..!!
Follow me On Twitter & Telegram For More Regular Updates..!!
Public Telegram Channel:
t.me/CryptoCove
Forex Telegram Channel:
t.me/Captain_FX
Twitter:
twitter.com/CryptoFaibik
Instagram :
instagram.com/captain_faibik
Public Telegram Channel:
t.me/CryptoCove
Forex Telegram Channel:
t.me/Captain_FX
Twitter:
twitter.com/CryptoFaibik
Instagram :
instagram.com/captain_faibik
Disclaimer
The information and publications are not meant to be, and do not constitute, financial, investment, trading, or other types of advice or recommendations supplied or endorsed by TradingView. Read more in the Terms of Use.