Chart Breakdown
🟢 Pattern:
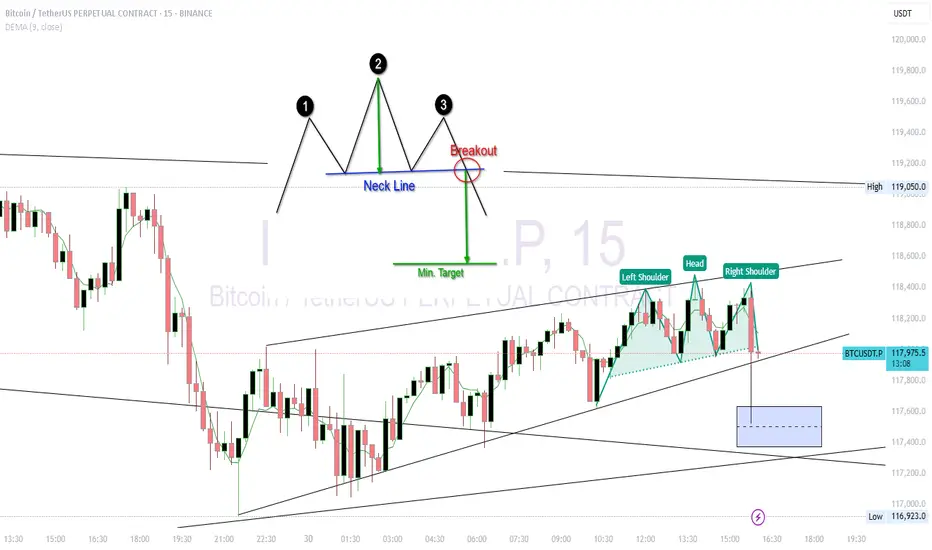
Left Shoulder: 118,450
Head: ~118,600
Right Shoulder: ~118,400
Neckline: Sloping slightly upward, around 118,050
📌 Bearish Breakdown Scenario
If BTC breaks below the neckline (~118,000) with volume, the expected drop (measured move) is:
Height of pattern:
Head (118,600) – Neckline (118,000) = 600 pts
Target on breakdown:
118,000 – 600 = ~117,400
🔻 Target: 117,400–117,300
🔒 Invalidation: Price closes above 118,300 with strong volume.
🟢 Pattern:
Left Shoulder: 118,450
Head: ~118,600
Right Shoulder: ~118,400
Neckline: Sloping slightly upward, around 118,050
📌 Bearish Breakdown Scenario
If BTC breaks below the neckline (~118,000) with volume, the expected drop (measured move) is:
Height of pattern:
Head (118,600) – Neckline (118,000) = 600 pts
Target on breakdown:
118,000 – 600 = ~117,400
🔻 Target: 117,400–117,300
🔒 Invalidation: Price closes above 118,300 with strong volume.
Disclaimer
The information and publications are not meant to be, and do not constitute, financial, investment, trading, or other types of advice or recommendations supplied or endorsed by TradingView. Read more in the Terms of Use.
Disclaimer
The information and publications are not meant to be, and do not constitute, financial, investment, trading, or other types of advice or recommendations supplied or endorsed by TradingView. Read more in the Terms of Use.