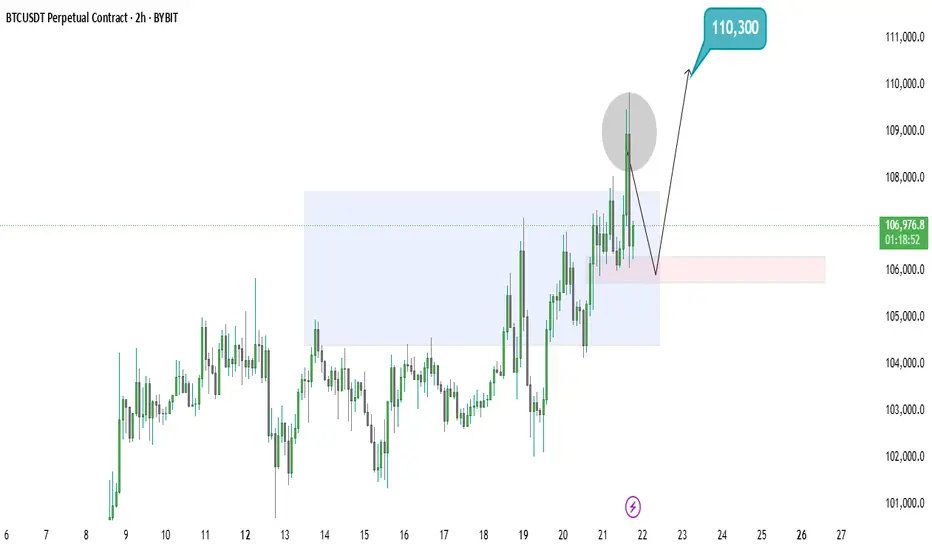
BTCUSDT – 4H Chart Analysis
Bitcoin appears to be ranging slightly on the 4H chart, likely consolidating after a previous move Recent price action is forming a familiar bullish structure – potentially a breakout + retest scenario If price retests previous resistance as support and shows a strong bullish reaction (e.g., engulfing candles, volume spike), it could confirm buy-side strength.
Next major resistance level you've identified is 110,300 USDT – likely a significant psychological or technical level.
You can see more details in the chart Ps Support with like and comments I will be Glad
Join My telegram Channel
t.me/+H8GlkRY1oZVkNTJk
Free Forex Signals
t.me/Asher_Trader01
t.me/+H8GlkRY1oZVkNTJk
Free Forex Signals
t.me/Asher_Trader01
Related publications
Disclaimer
The information and publications are not meant to be, and do not constitute, financial, investment, trading, or other types of advice or recommendations supplied or endorsed by TradingView. Read more in the Terms of Use.
