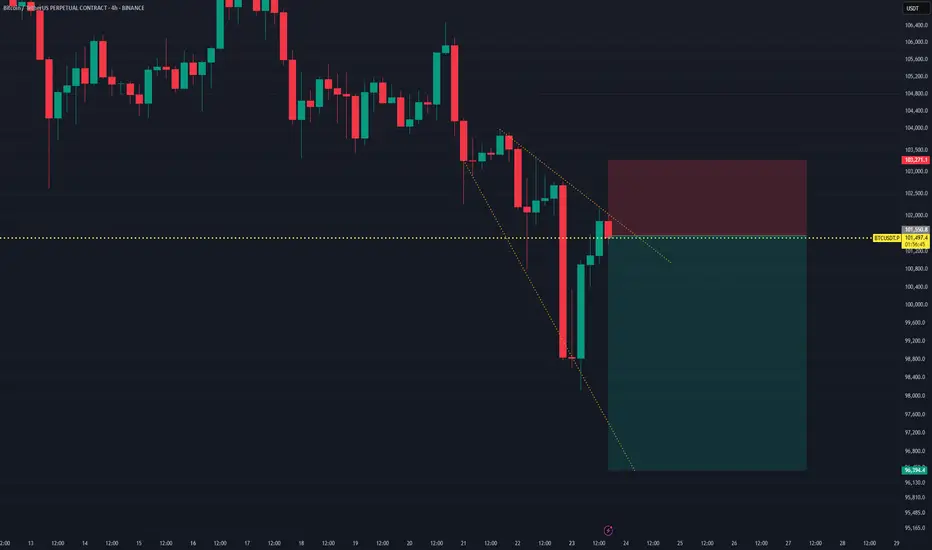
The BTCUSDT perpetual chart displays a bearish setup following a false breakout or weak retest of a descending wedge structure. After a strong bounce from the recent low, price surged but is now showing rejection at the $101,500 resistance level, marked by a key horizontal zone.
This area coincides with:
- The upper boundary of the falling wedge pattern.
- A former support zone now acting as resistance.
- A red candle signaling exhaustion from buyers.
A short position is initiated with:
- Entry: ~$101,500
- Stop Loss: ~$103,271
- Take Profit: ~$95,400
- Risk:Reward Ratio: ~1:3+
Unless price reclaims and holds above $103,271, this setup suggests a short-term bearish reversal is likely to unfold.
Disclaimer
The information and publications are not meant to be, and do not constitute, financial, investment, trading, or other types of advice or recommendations supplied or endorsed by TradingView. Read more in the Terms of Use.
Disclaimer
The information and publications are not meant to be, and do not constitute, financial, investment, trading, or other types of advice or recommendations supplied or endorsed by TradingView. Read more in the Terms of Use.