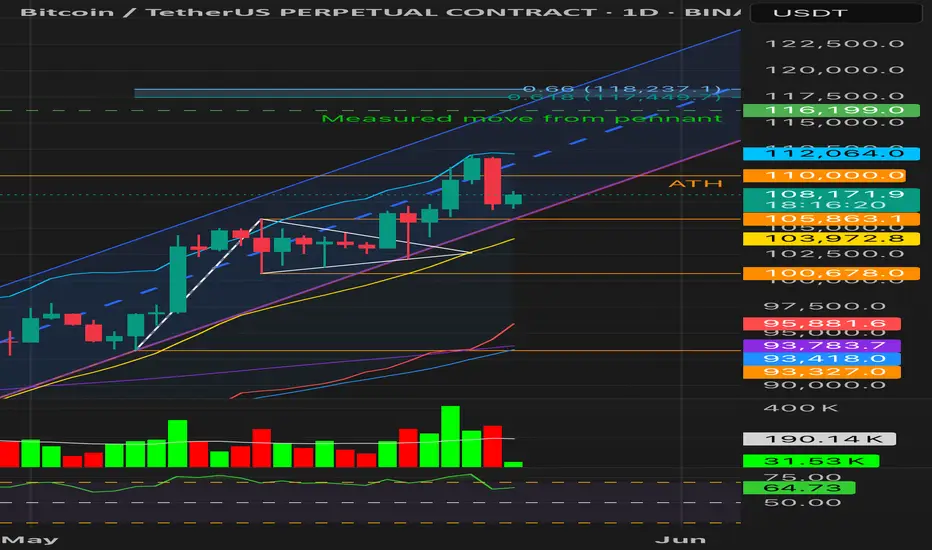
1D Chart
• Price broke above ATH (~110K) on May 22 with a +1.87% gain, backed by strong volume (~413K vs 190K avg) — signaling legitimate breakout intent.
• May 23 followed with a -3.93% bearish engulfing candle, closing back below ATH on elevated sell volume (~279K).
• Despite the rejection, the breakout bar showed no upper wick exhaustion, so not a blow-off.
• RSI = 63.26 — still bullish but curling down.
• Price is testing the channel midline; Fib extensions (117.4K–118.2K) remain unmet.
Conclusion: Initial breakout was technically valid and volume-confirmed, but price is now under threat.
Loss of 103.9K would invalidate the structure and raise distribution risks.
⸻
4H Chart
• Price closed 4 times below mid-Bollinger Band — short-term momentum has weakened.
• RSI bounced back above 50, avoiding breakdown territory.
• Volume is tapering (weekend), and price is hovering just above the previous LPS zone.
• Watching for resolution from a potential Backup (BU) retest.
⸻
Wyckoff View
• Still within Phase E of re-accumulation — unless 103–105K breaks decisively.
• Valid structure: Spring → LPS → SOS → BU(?)
• A break below structure = possible UTAD scenario
⸻
Key Levels
• Support: 105,863 / 103,986 / 100,678
• Resistance: 110,000 / 112,100 / 116,199
• Target Extension Zone: 117,449 – 118,237
Protect your Bitcoin investment with our realtime alerts and fully automate your trading. No more sleepless nights, black swans, rug pulls, whale pump & dumps or getting sidelined.
Related publications
Disclaimer
The information and publications are not meant to be, and do not constitute, financial, investment, trading, or other types of advice or recommendations supplied or endorsed by TradingView. Read more in the Terms of Use.