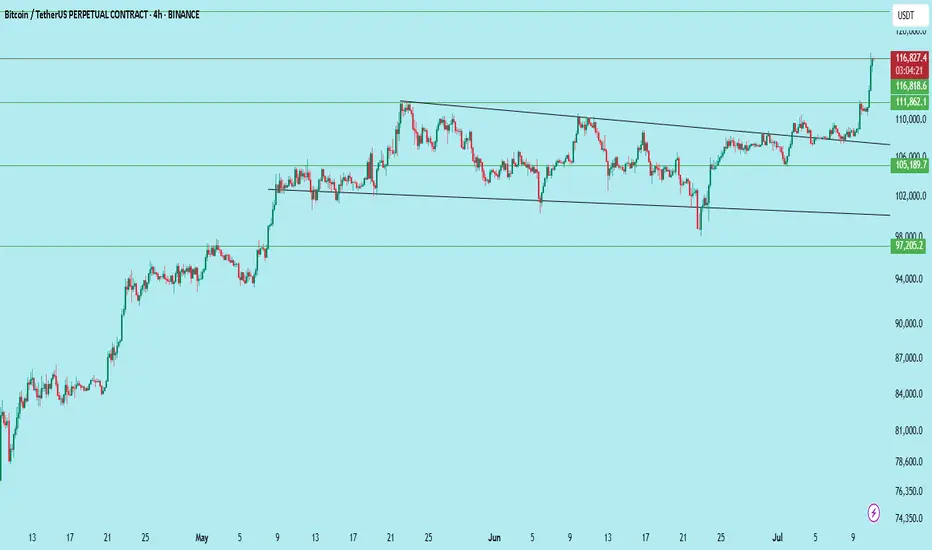
BTC/USDT has officially broken out of the descending channel it was consolidating in for over a month. The breakout was strong, clearing the horizontal resistance at $111,862, flipping it into support.
Chart Structure:
Descending channel broken to the upside
Horizontal resistance is flipped to support
Volume confirmed breakout momentum
Key Levels:
Support: $111,862 → Newly flipped support
Resistance Zones Ahead:
$116,818
$122,342
Upside Targets:
Immediate: $116,818
Extended: $122,342
Caution: Avoid FOMO. Wait for a retest near $111,800–$112,200 to confirm breakout strength.
Bias: Bullish
Timeframe: 4H
Wait for confirmation before fresh entries.
DYOR | Not financial advice
#BTC #Bitcoin
Related publications
Disclaimer
The information and publications are not meant to be, and do not constitute, financial, investment, trading, or other types of advice or recommendations supplied or endorsed by TradingView. Read more in the Terms of Use.
Related publications
Disclaimer
The information and publications are not meant to be, and do not constitute, financial, investment, trading, or other types of advice or recommendations supplied or endorsed by TradingView. Read more in the Terms of Use.